Number of Projects
The Number of Projects graphs display projects marked as In-progress and Completed.
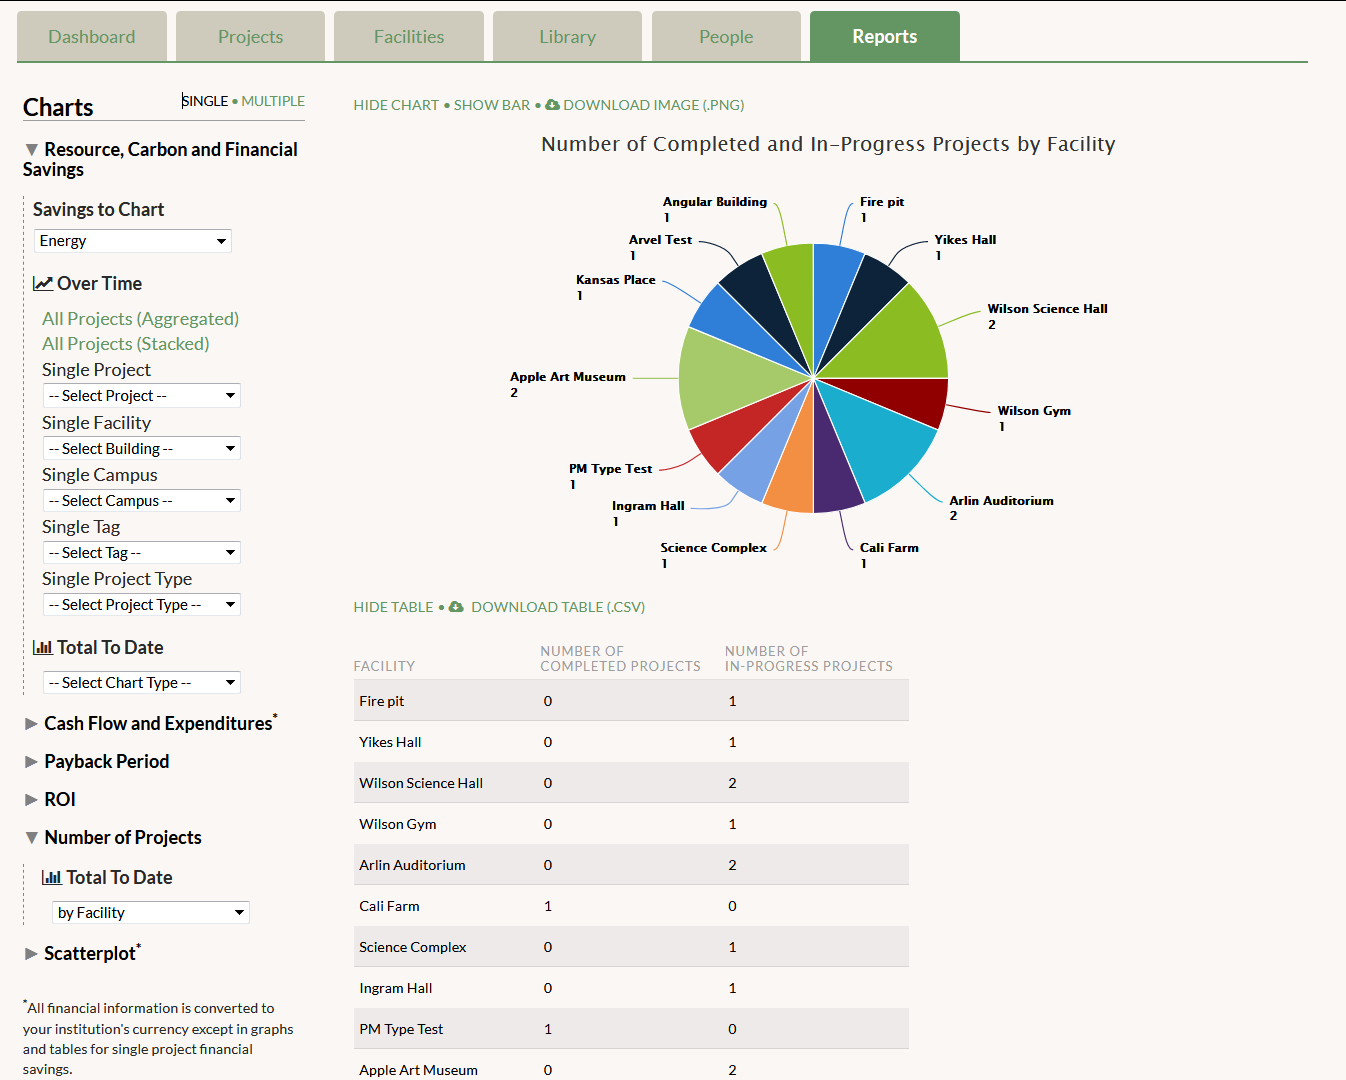
- By Facility: This option displays a pie chart of the number of projects linked to each building in GRITS. The total number of projects appears below the name of each facility, and projects are divided by their In-progress or Completed status in the table under the chart. In this chart you can see if projects have been heavily focused on a single building or widespread among campus buildings. Click on “Show Bar” to view it as a bar graph instead of as a pie chart.
- By Tag: If you have attached tags to your projects, this chart allows you to view the number of projects connected to each tag. The total number of projects appears below the name of each tag, and projects are divided by their In-progress or Completed status in the table under the chart.
- By Campus/Site: You’ll only see this option if you’ve created more than one campus/site. This option displays a pie chart of the number of projects funded in each campus/site in GRITS. The total number of projects appears below the name of each facility, and projects are divided by their In-progress or Completed status in the table under the chart. In this chart you can see if projects have been heavily focused on a single campus or widespread among several campuses. Click on “Show Bar” to view it as a bar graph instead of as a pie chart.
- By Project Type: This option displays a pie chart of the number of projects funded according to Project Type. The total number of projects appears below the name of each Project Type, and projects are divided by their In-progress or Completed status in the table under the chart. In this chart you can see if projects have been heavily focused on a specific Project Type or if you are funding many different types of projects. Click on “Show Bar” to view it as a bar graph instead of as a pie chart.