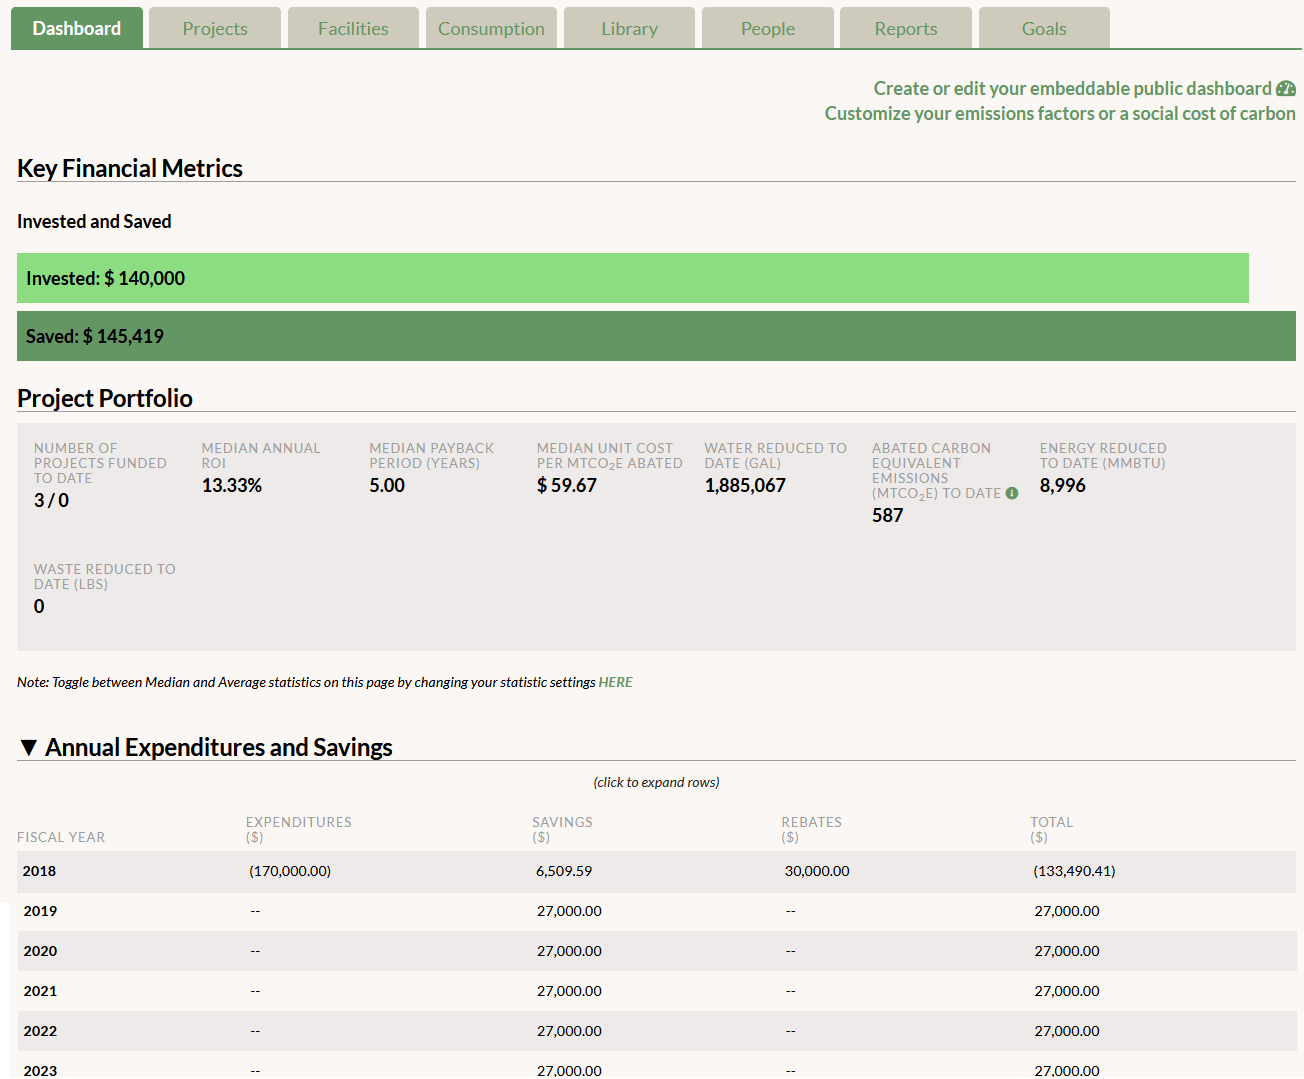
When your GRITS account is first created, it will be populated with three example projects in order to illustrate the types of calculations that GRITS performs for you. If your account has a saved project limit, these example projects won’t count towards that limit. When you begin entering real projects into your account, you should delete the example projects to prevent them from mixing into the aggregate metrics calculated on the Projects tab.
- When you log in, you’ll land on the Dashboard page and see a tally of funds invested in projects to today’s date and a tally of the financial savings achieved by the example projects in your account. You’ll also see some aggregate metrics across these three projects, like median annual return on investment (ROI), followed by a table containing the hypothetical cash flows associated with them.
- Note: Once you create a project and mark it as either In-Progress or Completed, data from any example projects in your account will be removed from the calculations on the Dashboard. This prevents any cash flow data from potentially real projects mixing with data from the example projects.
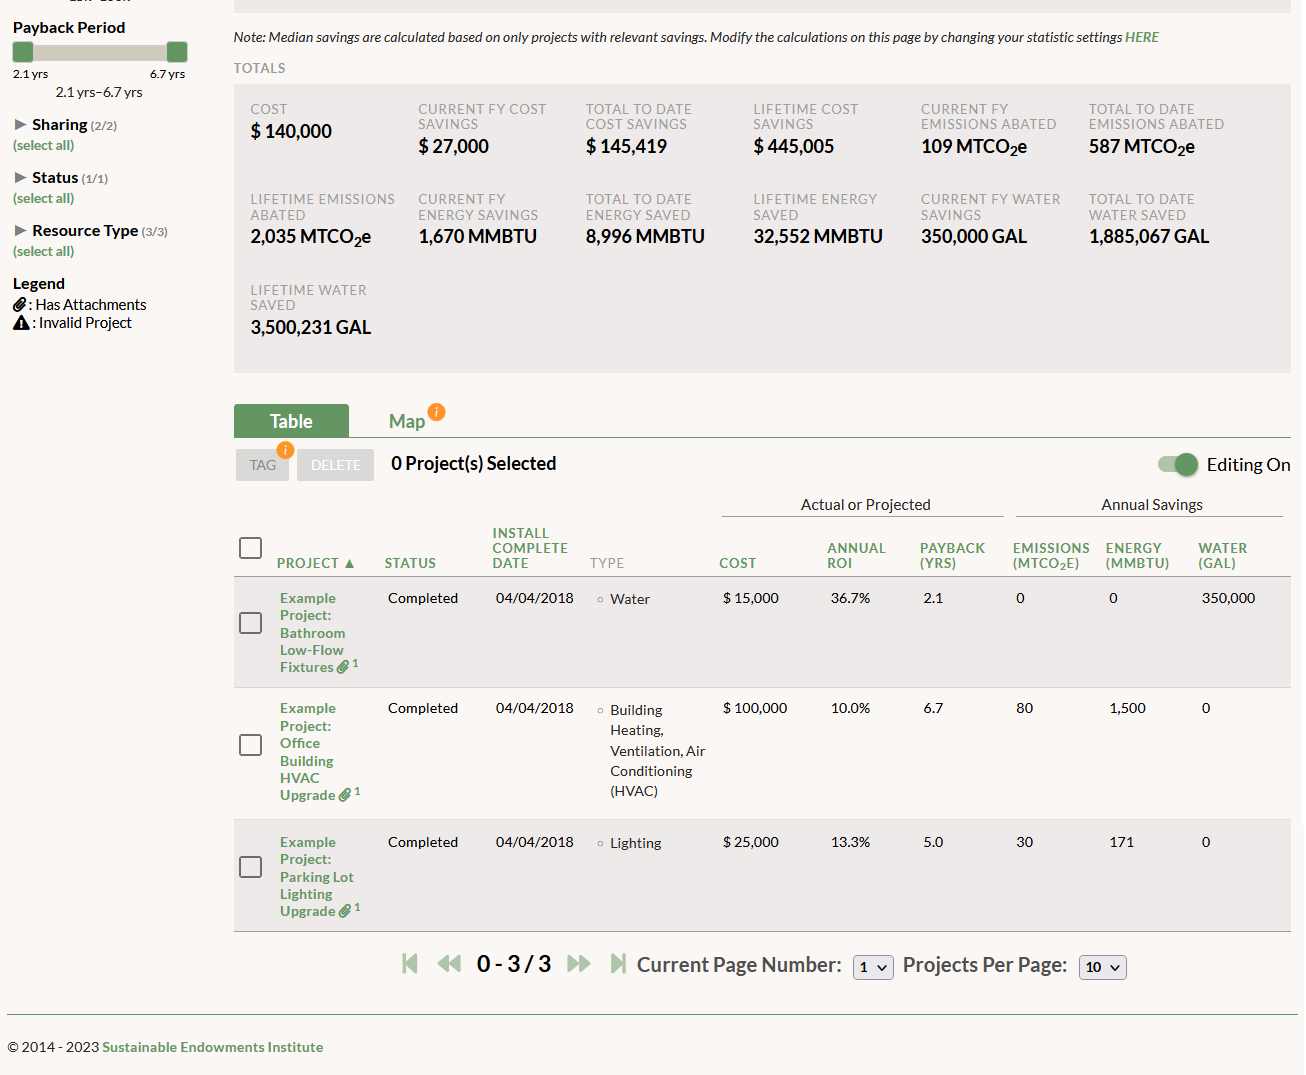
- On the Projects tab, you’ll see median and total calculations (e.g. median ROI and total carbon emissions abated to date) derived from the example projects.
- Note: Unlike the Dashboard, data from the example projects continues to be factored into the metrics calculated on the Projects tab even after you enter In-Progress or Completed projects. You should delete the example projects once you start entering your own real projects in order to avoid mixing in their data.
- On the Reports tab, you’ll see multi-project charts that display the various impacts of the example projects (e.g. energy, emissions, water, waste, and financial savings). You can also view charts of each individual example project’s savings.
- Note: Like on the Dashboard, once you create a project and mark it as either In-Progress or Completed, data from any example projects in your account will be removed from the multi-project charts on the Reports tab. This prevents any resource savings data from potentially real projects mixing with data from the example projects.