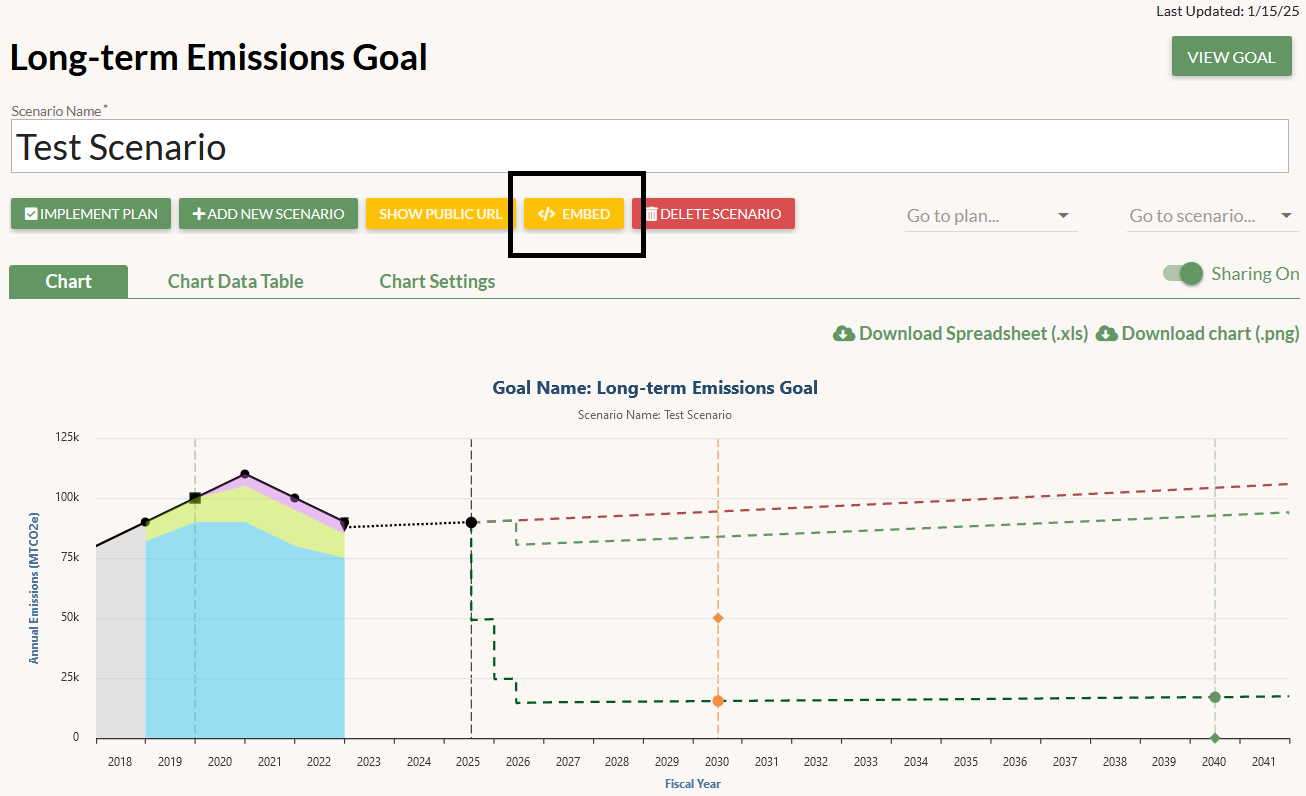
On the Scenario page you can design a dashboard with elements from your scenario that you can embed into your institution’s website. Click on the “Embed” button to get started.
At the top of the embeddable dashboard modal window you can choose whether to include or exclude whole sections of the Scenario page in your dashboard: the Scenario Chart, Scenario Projects Timeline, Progress table, Savings Over Time table, and Financial Metrics table. You must select at least one section to include in the dashboard.
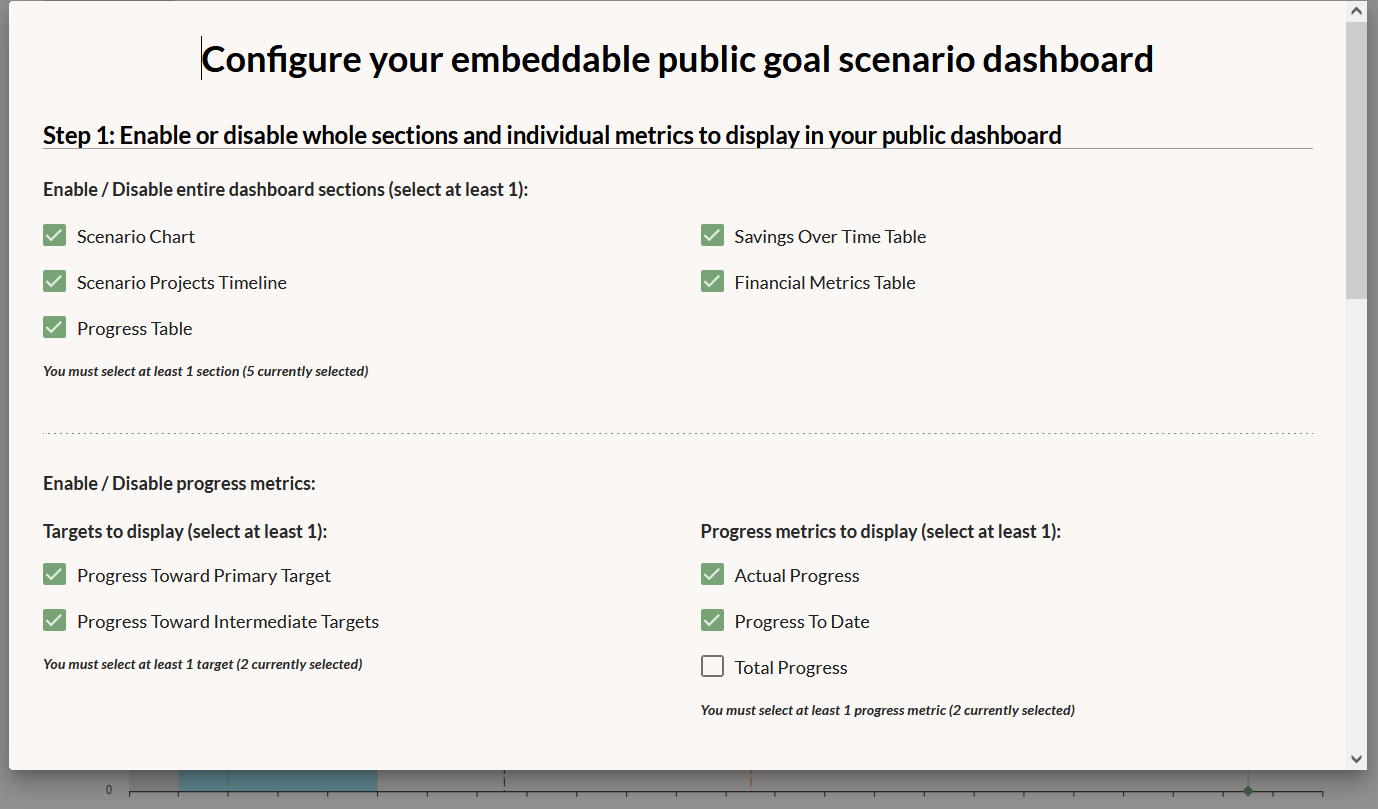
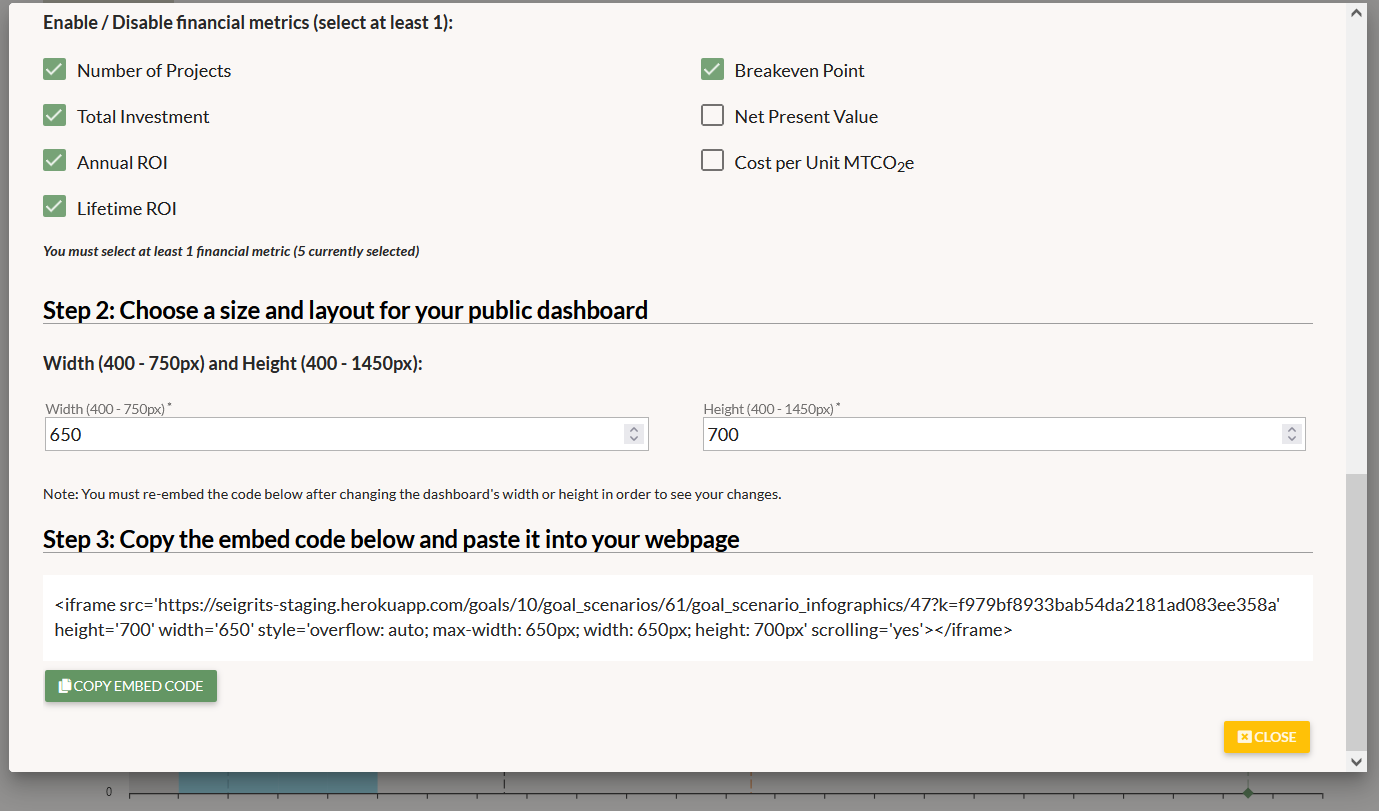
If you plan to include any of the tables in your dashboard, you can also choose which metrics from those tables to present. You must select at least one metric.
Once you’ve selected the elements and metrics you’d like to include in the dashboard, you can set its width and height. When you’re finished customizing the dashboard, just copy the embed code and paste it into the webpage where you’d like it to appear. Any updates to that scenario will be reflected in its dashboard.
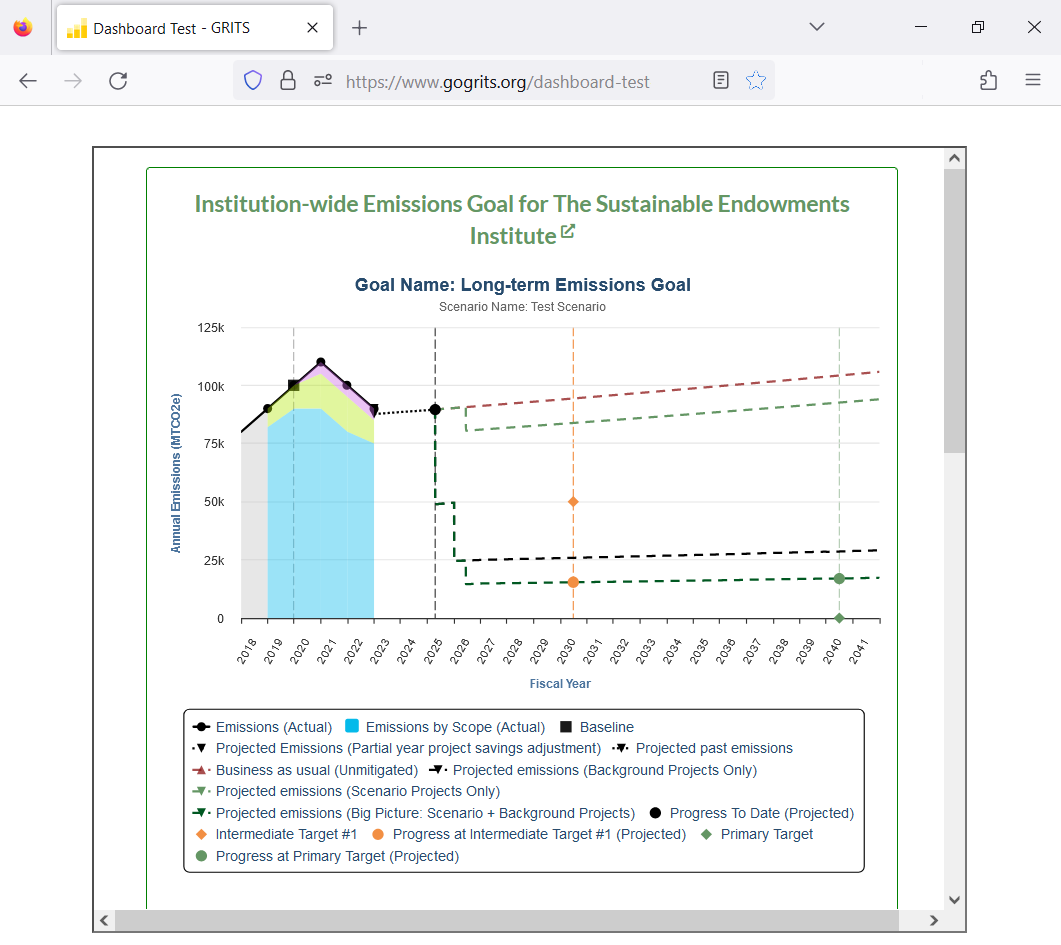
If you include the Scenario Chart, it will remain interactive for all viewers just as it is on the Scenario page (allowing viewers to see the data in the chart by hovering with their cursor and remove chart elements by deselecting them from the chart legend). The resulting dashboard will look like this: