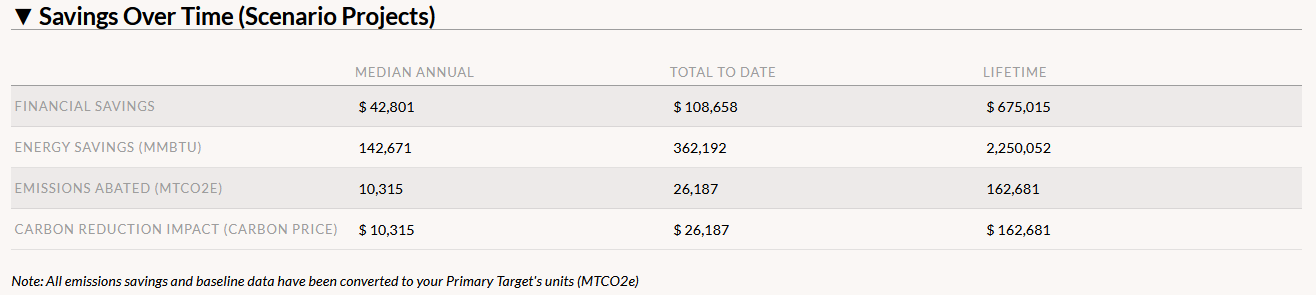
GRITS Guide

⌘K
  1. Home
  2. GRITS Guide
  3. Goals Tab
  4. Scenario Page – Impacts

Scenario Page – Impacts

The Impacts table describes the environmental impact of your scenario. It displays various savings metrics for each resource saved by your scenario projects. For example, an energy consumption reduction scenario will display energy savings as well as emissions abated by the scenario projects (and any additional water or waste savings resulting from those projects). All metrics will be presented in your primary target’s units (e.g. if your primary target is 20,000 MMBTU, all savings stats will be presented in MMBTU). There are three different metrics calculated for each saved resource: median/average annual savings, savings to date, and lifetime savings.

  • The Median/Average Annual [Energy/Carbon/Water/Waste] Savings calculation depends on whether you have selected the median or mean calculation of central tendencies in the “Math, Units, and Stats” sub-tab of the Settings page. Median is selected by default because it better excludes outliers. If median is selected, this metric will be called “median annual savings”.  If you have selected mean, this metric will be called “average annual savings”.
    • If median is selected: The bundle of projects in the scenario is treated like one large project. First, the individual project savings in each fiscal year are summed to get the scenario’s total energy savings in each fiscal year. The scenario’s total fiscal year savings are then arranged from smallest to largest, and the value in the middle is selected. If there is no single middle value, then the two values in the middle are averaged to calculate the median.
    • If mean is selected: The bundle of projects in the scenario is treated like one large project. The lifetime savings for each project are summed and then divided by the scenario lifespan in years. The scenario lifespan is measured from the earliest project start date to project expiration date furthest in the future. Equation: [(Lifetime energy savings for project 1) + (Lifetime energy savings for project 2) + …] / (scenario lifespan in years)
  • The [Energy/Carbon/Water/Waste] Savings to Date metric is calculated by adding the resource savings to date for all projects in this scenario. For Proposed projects, savings to date are measured from their implementation date in the scenario rather than the projected install complete date on their Project Details page (therefore the savings to date displayed on a Project Details page may not match the savings to date used in the scenario’s calculation).
    • Equation: (Energy savings to date for project 1) + (Energy savings to date for project 2) + …
  • The Lifetime [Energy/Carbon/Water/Waste] Savings metric is calculated by adding the lifetime energy savings for all projects in this scenario.
    • Equation: (Lifetime energy savings for project 1) + (Lifetime energy savings for project 2) + …

You can also see progress metrics in the Impacts table that tell you how close to your targets you can expect to get if you implement the scenario projects. There are two types of progress metrics for both intermediate and primary targets, “projected to date” and “projected total”.

  • Progress Towards Intermediate Target (projected to date) is the portion of the intermediate resource reduction task accomplished by today’s date. The intermediate resource reduction task is just the distance between the baseline and the intermediate target. The resource consumption/emissions amount projected on today’s date is divided by that value to calculate this stat.
    • Equation: (baseline resource consumption/emissions amount – scenario’s projected resource consumption/emissions amount on today’s date) / (baseline resource consumption/emissions amount – intermediate target resource consumption/emissions amount)
  • Progress Towards Primary Target (projected to date) is the portion of the total resource reduction task accomplished by today’s date. The total resource reduction task is just the distance between the baseline and the primary target. The resource consumption/emissions amount projected on today’s date is divided by that value to calculate this stat.
    • Equation: (baseline resource consumption/emissions amount – scenario’s projected resource consumption/emissions amount on today’s date) / (baseline resource consumption/emissions amount – primary target resource consumption/emissions amount)
  • Progress Towards Intermediate Target (projected total) is the portion of the intermediate resource reduction task accomplished by the intermediate target date. The intermediate resource reduction task is just the distance between the baseline and the intermediate target. The resource consumption/emissions amount projected on the intermediate target date is divided by that value to calculate this stat.
    • Equation: (baseline resource consumption/emissions amount – scenario’s projected resource consumption/emissions amount on intermediate target date) / (baseline resource consumption/emissions amount – intermediate target resource consumption/emissions amount)
  • Progress Towards Primary Target (projected total) is the portion of the total resource reduction task accomplished by the primary target date. The total resource reduction task is just the distance between the baseline and the primary target. The resource consumption/emissions amount projected on the primary target date is divided by that value to calculate this stat.
    • Equation: (baseline resource consumption/emissions amount – scenario’s projected resource consumption/emissions amount on primary target date) / (baseline resource consumption/emissions amount – primary target resource consumption/emissions amount)