ROI
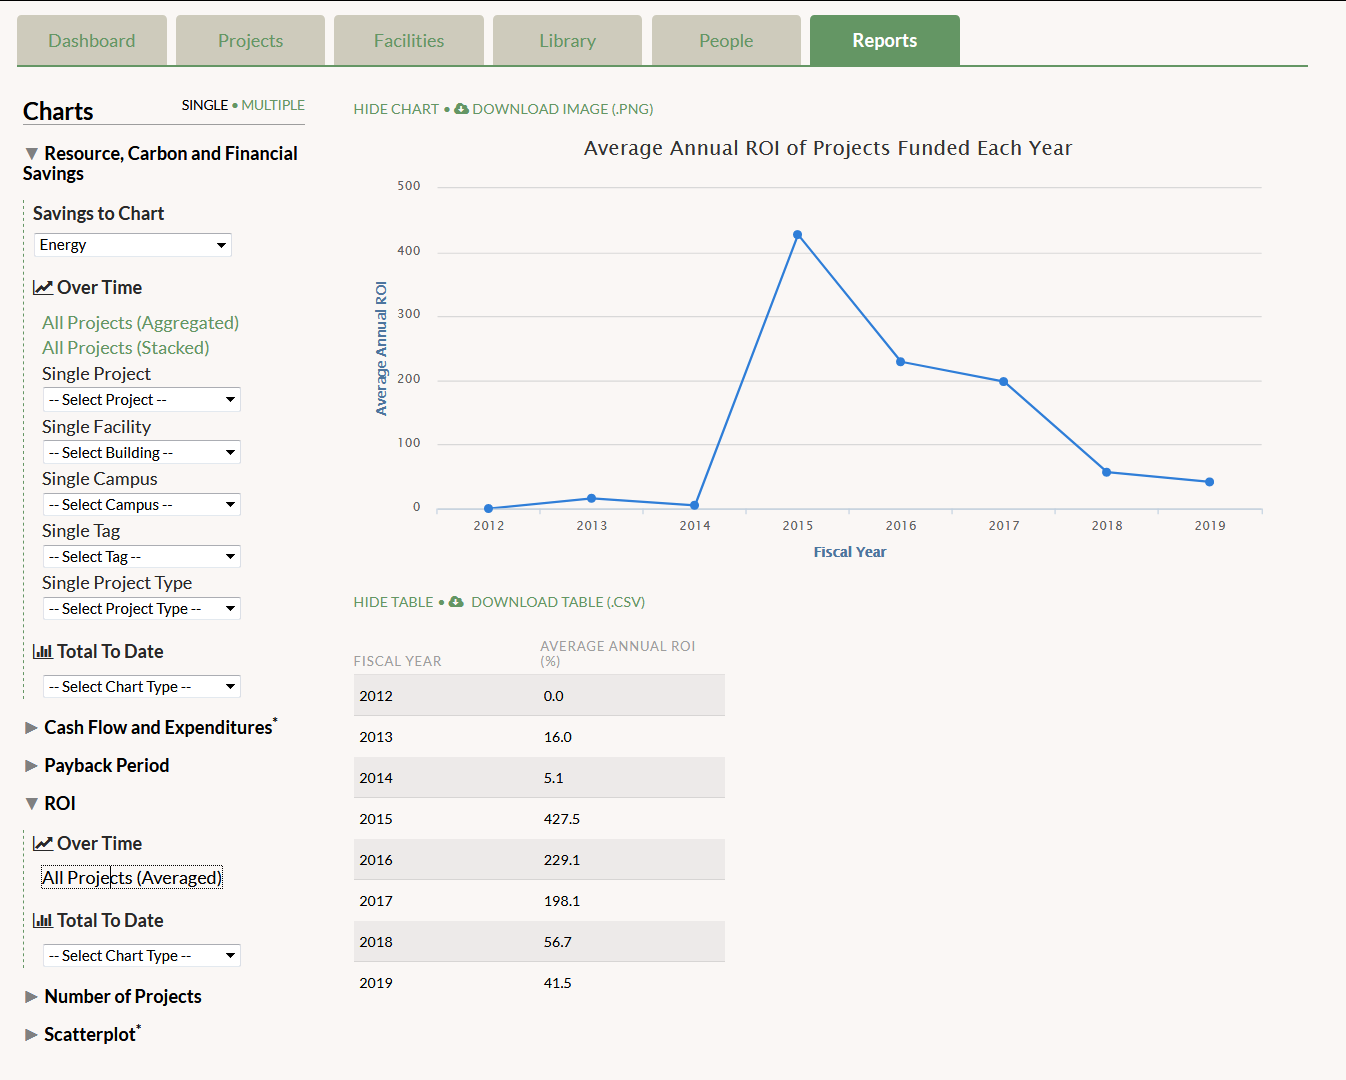
- Over Time: This graph displays the average annual ROI of projects funded each year. Here you can see if your projects have generally moved to smaller ROIs or larger ROIs as the fund matured. For a year in which no new projects were funded, the average will be zero.
- By Facility: This graph displays the average annual ROI of projects in each building in GRITS. If a project occurs in multiple buildings, its ROI will be applied to the averages in all of those buildings.
- By Tag: This graph displays the average annual ROI of projects linked to each tag you’ve created. If a project has multiple tags, its ROI will be applied to the averages for all of those tags.
- By Campus/Site: You’ll only see this option if you’ve created more than one campus/site. This graph displays the average annual ROI of projects in each campus/site in GRITS. If a project occurs in multiple campuses, its ROI will be applied to the averages in all of those campuses.
- By Project Type: This graph displays the average annual ROI of projects according to their Project Type. If a project has multiple Project Types, its ROI will be applied to the averages in all of those types. Here you can see which Project Types have the smallest and largest ROIs.