The Financial Metrics table describes the financial performance of the bundle of projects in your scenario.
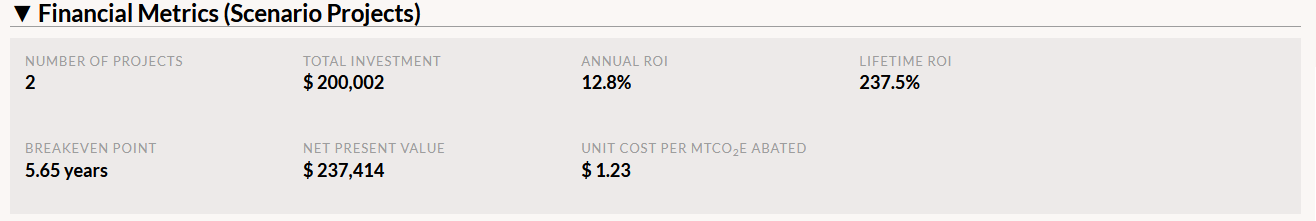
- Number of Projects shows you how many projects belong to this scenario and are incorporated into these financial metrics. Note that the stats of these projects appear individually in the Scenario Project Attributes table at the bottom of the Scenario page.
- Total Investment displays the total cost of all projects in the scenario. Each project’s cost is the sum of its Project Expenditure transactions. If no Project Expenditure transactions have been created, then the project’s Proposed Cost is used.
- Equation: (Cost of project 1) + (Cost of project 2) + …
- Annual and Lifetime Return on Investment stats are calculated by treating the bundle of projects in the scenario like one large project.
- Annual ROI equation: Lifetime ROI / scenario lifespan in years
- Lifetime ROI equation: (total lifetime savings for all scenario projects – total cost of all scenario projects) / (total cost of all scenario projects)
- The Breakeven Point displays the amount of time it takes for aggregate project savings to equal the scenario’s total investment amount (as measured from the start date of the first scenario project). At that point, the scenario has paid for itself—even the projects that have yet to be installed. Single-project scenarios will have a Breakeven Point that matches that project’s Payback Period.
- Equation: Sum daily savings occurring from the earliest scenario project’s start date until savings break even with (equal or exceed) the total cost of all scenario projects. The amount of time covered over that period is the Breakeven Point.
- Net Present Value as defined by Investopedia.com: ‘The difference between the present value of cash inflows and the present value of cash outflows.’ If it is positive, the scenario is a profitable investment. Estimated until end of scenario lifespan. Because the investments (projects) and savings occur at irregular intervals, the xNPV equation is used to calculate this metric.
- Unit Cost Per MTCO2e Abated is the cost of reducing carbon emissions. Estimated until end of scenario lifespan.
- Equation: Total Investment / Lifetime Emissions Abated