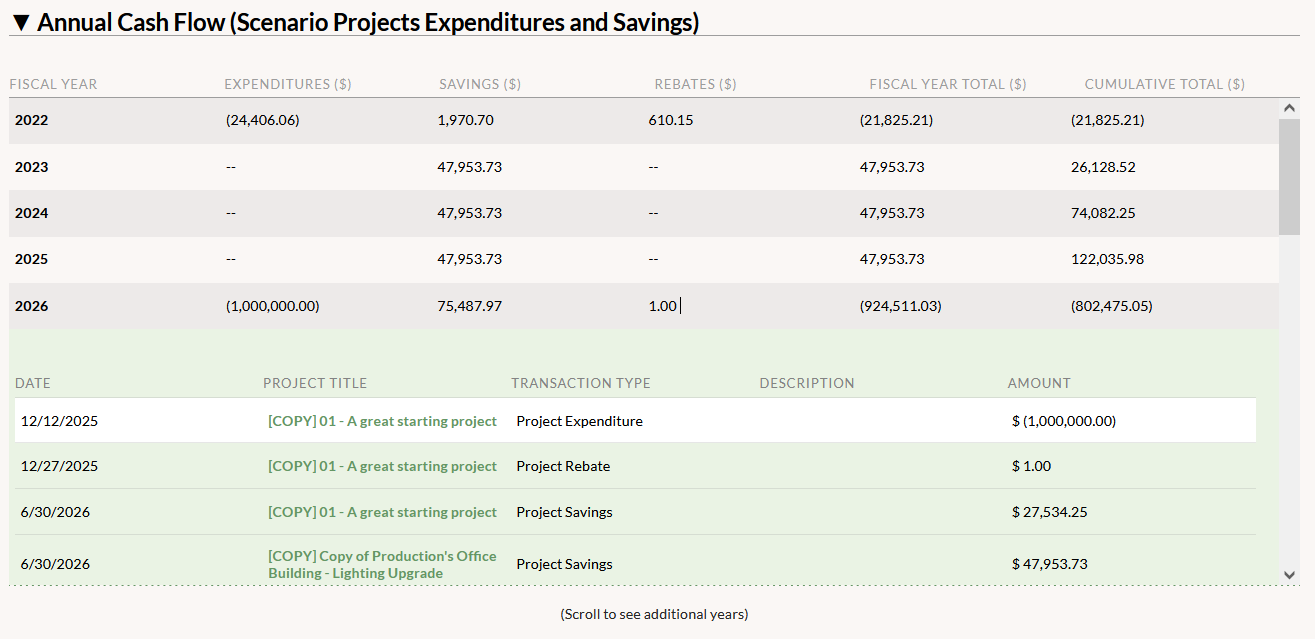
The Annual Cash Flow table displays all of the transactions and financial savings (projected or actual) associated with your scenario projects. The data is available for each fiscal year in the scenario’s lifespan, which begins with the earliest installed project and ends on the project expiration date furthest in the future. Each row corresponds to a full fiscal year. Click any row to expand it and see a data breakdown for each active project in that year. Active projects are those that are projected for installation before or during the fiscal year being reviewed and have not yet reached the end of their lifespan. All financial information is presented in your institution’s currency.
Several columns appear in the table:
- Expenditures: The total amount of money spent on projects. The table displays the total Project Expenditure transaction amount for each project. If no expenditure transaction has been created, then its Proposed Cost is shown instead. Any Project Expenditure transactions from Proposed projects are shown in the project’s implementation year in the Scenario Projects Timeline. Shifting a project from Proposed to In-Progress or Completed will cause its transactions to appear on the date they’re set to on its Project Details page.
- Savings: The sum of all financial savings from all active scenario projects. Savings begin to accrue on each project’s projected or actual install complete date in the Scenario Projects Timeline and stop at the end of the project lifespan.
- Rebates: The sum of all Project Rebate transactions from all active scenario projects.
- Fiscal Year Total: The aggregate cash flow in each fiscal year.
- Equation: Savings + Rebates – Expenditures
- Cumulative Total: The running cash flow, showing the overall savings achieved by the scenario. The sum of the current and all prior Fiscal Year Total amounts.