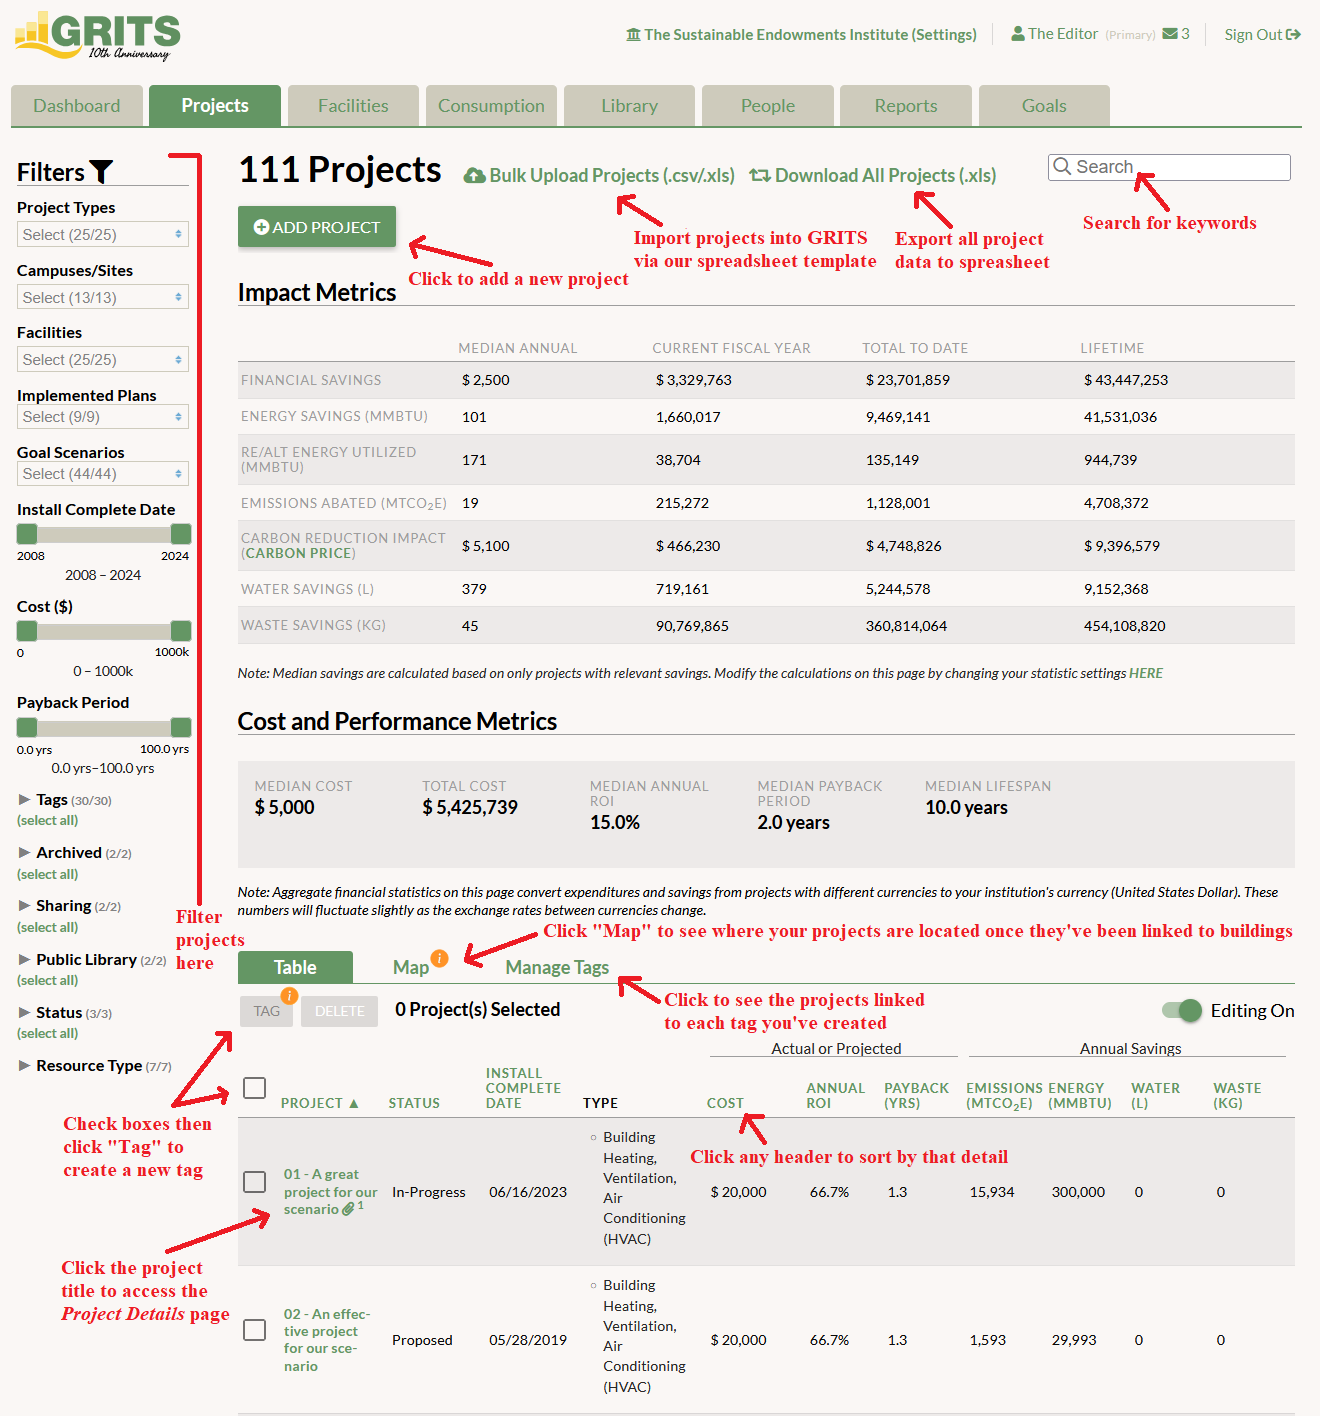
The tables on this page contain aggregate metrics that GRITS calculates across all of the projects you’ve filtered for (which appear in the lower table on the second half of the page). The table at the top, titled “Impact Metrics,” places each resource type (“Energy Savings”, “Emissions Abated”, etc.) into its own row. “RE/Alt Energy Utilized” refers to the amount of renewable or alternative energy used by your institution according to the renewable/alternative projects in your account. “Carbon Reduction Impact” refers to the estimated financial benefit of the emissions reduced by projects with a social cost of carbon framework applied. The columns in this table correspond to four different savings calculations: median/average annual (depending on your institutional stats settings), current fiscal year, total to date, and lifetime.
The lower table, titled “Cost and Performance Metrics,” displays project cost and financial metrics like return on investment and payback period.
You can look at all the projects in your portfolio or use the filters on the left side of the page to isolate specific groups of projects. Note that if any Proposed or In-Progress projects are among the group of projects currently shown, the aggregate metrics will reflect a combination of anticipated impacts and the actual impacts of your Completed projects. If you use a filter, the aggregate metrics will be recalculated to include only those projects within your filter criteria.
If you hover your cursor over the headers in these tables, a tool tip with more information will often appear.