
Using GRITS to Comply with Building Performance Standards
Growing numbers of cities and states are establishing building performance standards (BPS) that require buildings to reduce their energy consumption or carbon emissions (see many of them on a map here). GRITS can make BPS compliance easier and cheaper, empowering you to plan your own path forward (or to better understand the plans created by a consultant).
Once an energy audit has been performed and impactful energy/carbon reduction projects have been identified, these projects can be entered into GRITS so that you can evaluate your options in an easy-to-understand format. You can have consultants use GRITS on your behalf or save the expense and instead create your own plan for BPS compliance--no technical expertise required.
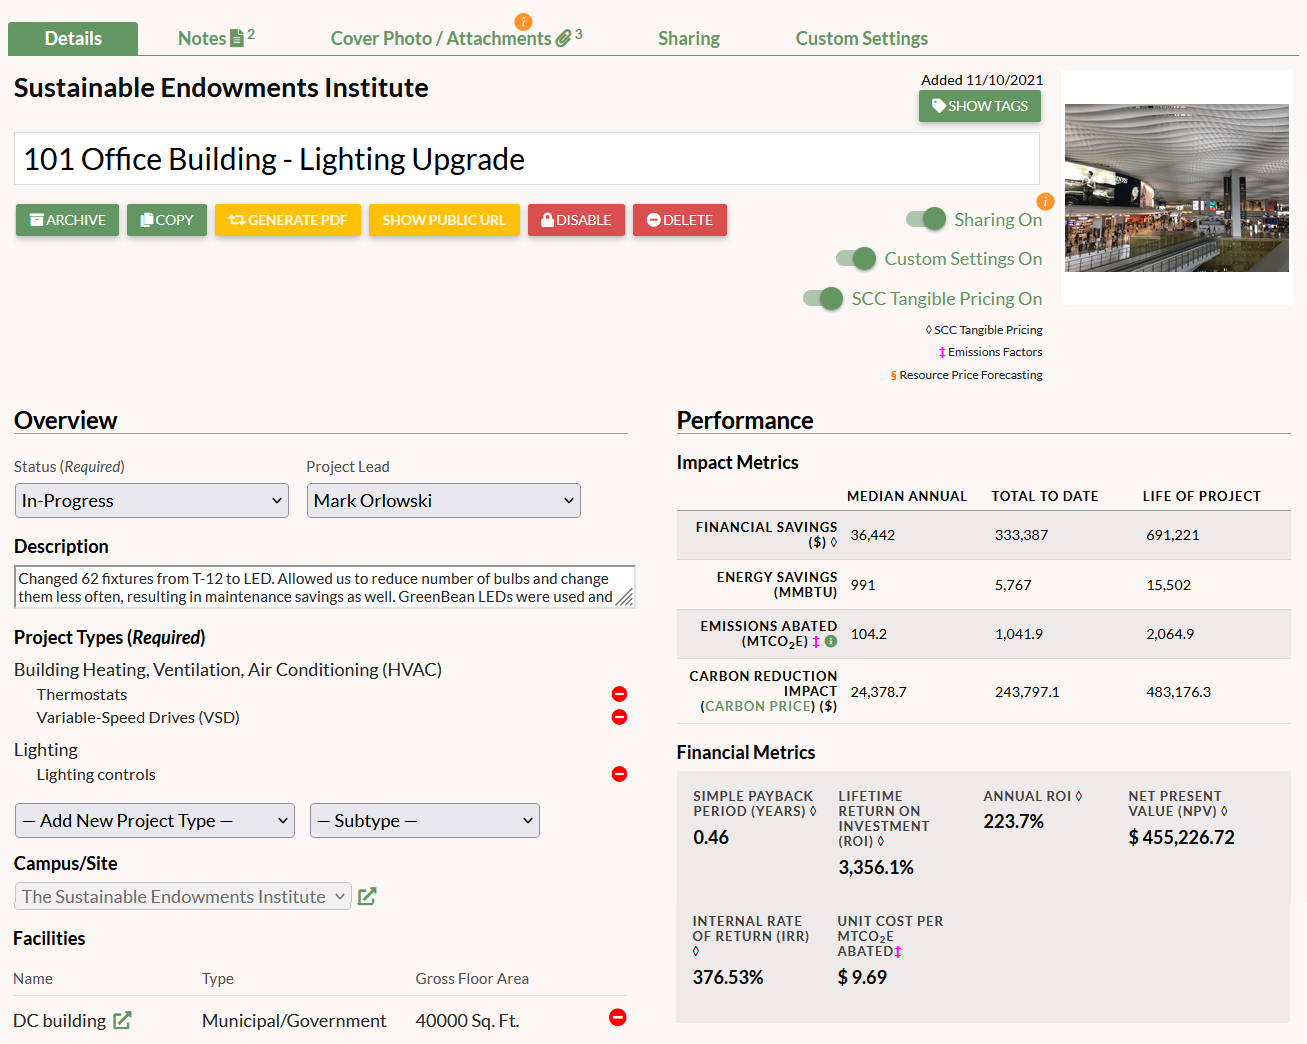
See the financial benefits of your projects, not just expenses: While the upfront costs of BPS compliance may draw your attention, GRITS calculates the financial savings associated with your energy efficiency and renewable energy projects along with metrics like annual return on investment and payback period. These metrics provide fuller context and a more balanced view of your project investments. Many of these projects pay for themselves over time, some in just a few years. Learn more.
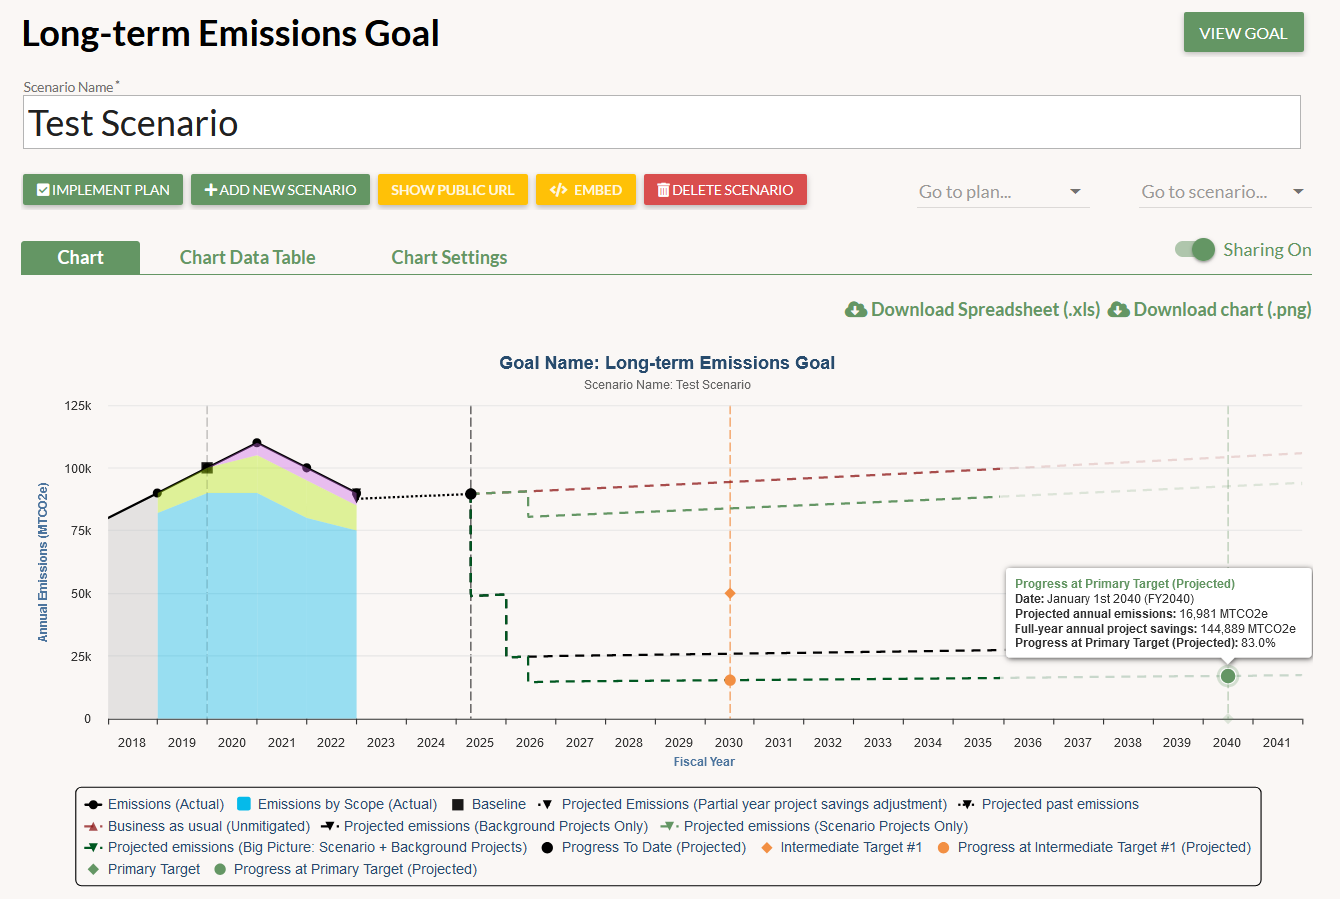
Calculate the costs you'll avoid through compliance: The social cost of carbon feature allows you to set a price on carbon and use it to estimate the financial benefits of reducing emissions. In the context of a BPS, this price can be the penalty per metric ton of emissions that you will have to pay if your emissions reductions are not sufficient to comply with the standard. GRITS calculates this financial benefit for each of your projects, and you can choose to formally incorporate it into the project's financial savings alongside reduced energy consumption (see "Carbon Reduction Impact" in the Impact Metrics table in the screenshot above).
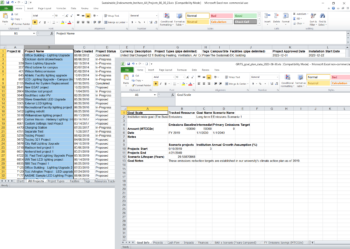
Easily build actionable BPS compliance plans: GRITS provides a suite of features for planning how you'll achieve energy or emissions reduction targets. You can create an unlimited number of scenarios in minutes by selecting different combinations of projects and implementation timelines. A centralized cash flow table shows you exactly when you'd make investments in projects and how financial savings would accrue to help offset those costs. Learn more.
![]()
Report projects and progress to program managers: Once you have entered projects and built energy/carbon reduction plans, GRITS offers several ways of reporting your data to BPS program managers. You can generate PDFs and spreadsheets containing your project data or share links to read-only versions of your compliance plans. Learn more.
Customize your emissions factors: If your institution operates in multiple locations or has unique circumstances (e.g., a private power plant owned by a university), you can customize your emissions factors to ensure that the emissions savings attributed to each project are calculated accurately.
Try GRITS for free for 14 days to see firsthand how it can support your BPS compliance efforts.
Making the Most of Your GRITS Account
Whether you're already a GRITS subscriber or are exploring how it can support your project management work during a trial period, there are a number of strategies and tasks you can undertake to make the most of your account:
- Think about your use cases
- Create log-ins for all other stakeholders
- Enter a project manually
- Upload projects and buildings
- Try out the sharing features
- Learn from peer institutions through the Project Library
- Generate reports
- Build a resource use reduction scenario
- Schedule a meeting with decision-makers
- Establish workflows to take full advantage of GRITS' features
1. Think about your use cases
GRITS has several use cases, but maybe you're particularly interested in certain ones. By thinking about your use cases, you'll better understand your priorities when using GRITS. You can use the platform to:
- Save time and effort by leaving spreadsheets behind for tracking your project-related cost and savings data
- Communicate the impacts of your projects to decision-makers and/or broader groups of stakeholders
- Plan how you'll achieve institutional emissions/energy use/water use/waste reduction goals
- Boost collaboration among different stakeholders or departments involved in the project approval/implementation process
- Learn from projects completed by peer institutions
- Track all cash flows associated with a green revolving fund
You should also consider whether other stakeholders at your institution could benefit from these use cases, and ask if any would be particularly helpful for them.
2. Create log-ins for all other stakeholders
Do you have colleagues who are involved in the project approval or implementation process and should have access to your GRITS account? Is there anyone you'd like to loop into that process so that they're aware of your work? If you're doing a GRITS trial and will need approval from particular decision-makers, should those individuals have access?
When thinking about who to add to your GRITS account, consider the following roles: facility/sustainability/energy managers who regularly deal with resource conservation projects, members of a finance or budget office who approve project funding requests, and communications or development professionals who may want to highlight project impacts in their work.
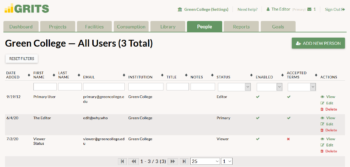
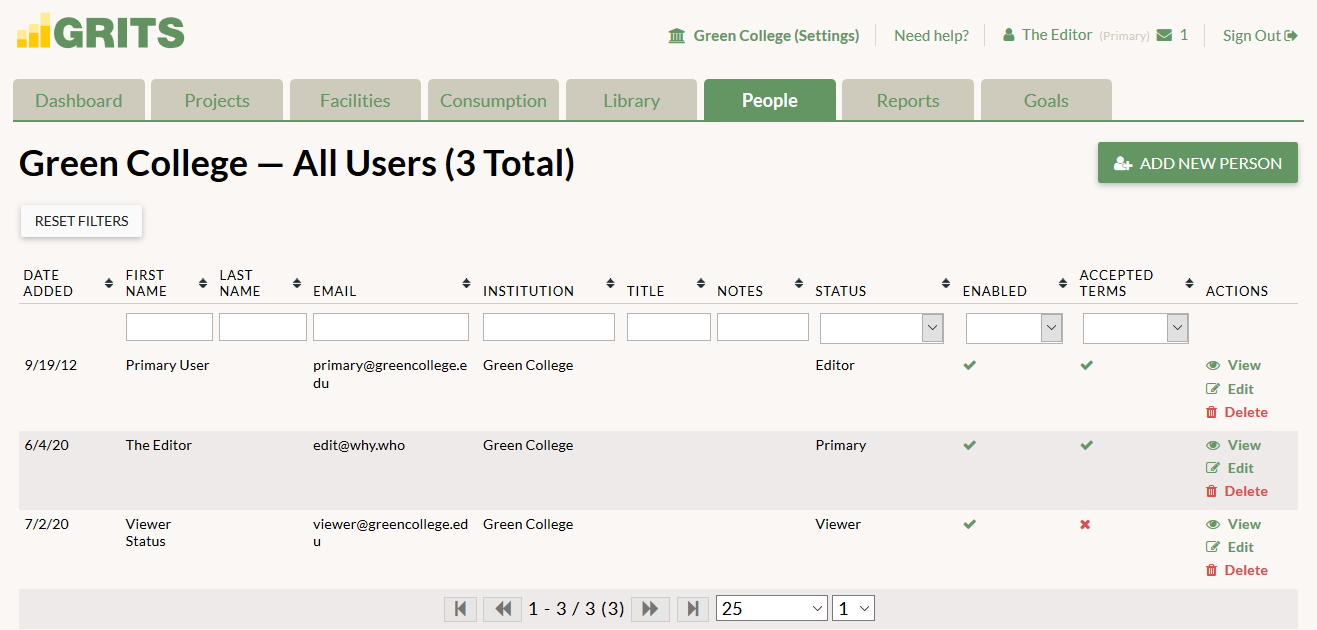
You can provide user-creation privileges to other account managers (Primary users), editing privileges for those entering project data (Editor users), and read-only privileges for those who just need visibility into your data (Viewer users). If you check the "Send welcome email" box when entering their information, GRITS will notify them of their access, but it's best to also reach out to them yourself to explain why you created their log-in.
3. Enter a project manually
All of the features that GRITS offers--project-level impact calculations, portfolio-wide metrics, charts, sharing tools, and more--stem from the project data in your account. You only need a handful of data points to create a project in GRITS. By manually entering a project, you'll learn about these data points and start to see all of the features that can support your work.
Learn more about the calculations that GRITS performs in this blog post or check out this GRITS Guide entry which illustrates the process of manually entering a project.
4. Upload projects and buildings
You can save time and quickly make your account reflect your institution's operations by using one of GRITS' bulk data entry options.
For building data: If you use Energy Star Portfolio Manager to track your building data, you can connect your accounts and import all of your building characteristic information (name, facility type, location, etc.) into GRITS. Follow the steps described in this GRITS Guide entry to use this option.
Another option to quickly create dozens of buildings in your GRITS account is to use our building upload spreadsheet template. Download this template on the Facilities tab via the Bulk Upload Facilities link. Just fill in the handful of required fields and use the same link to upload it.
For project data: To quickly create dozens of projects in your GRITS account, you can use our project upload spreadsheet template. Download this template on the Projects tab via the Bulk Upload Projects link. Just fill in the handful of required fields and use the same link to upload it.
5. Try out the sharing features
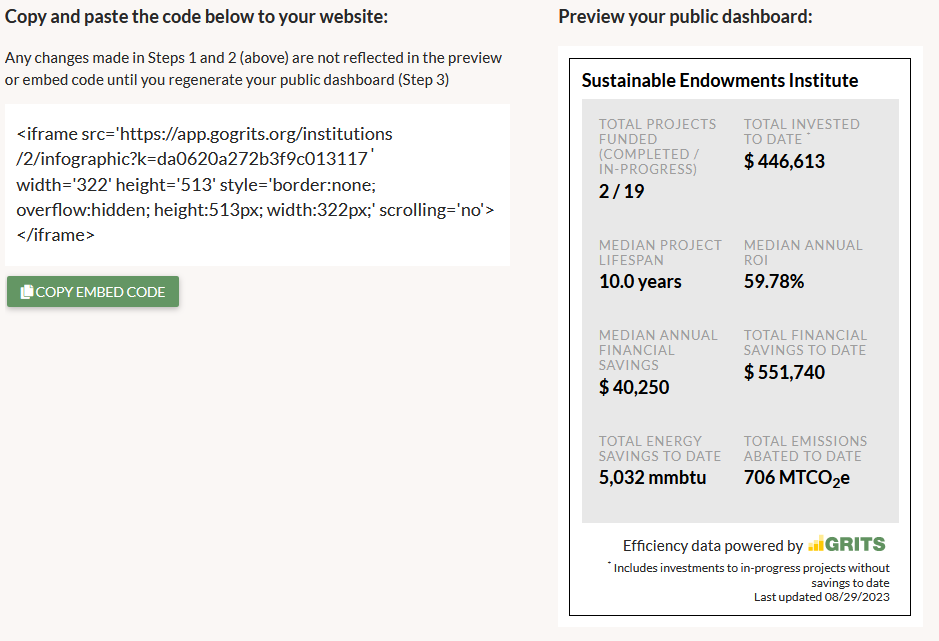
GRITS makes it easy to communicate the impacts of your projects with stakeholders. From read-only links to individual projects to public dashboards that display the cumulative impact of your portfolio, there are many ways to share your work. Check out this blog post, which highlights these sharing features and how to use them.
6. Learn from peer institutions through the Project Library
Non-profit GRITS users have access to the unique GRITS Project Library, which contains thousands of completed projects entered by other GRITS users from around the world. The platform also facilitates connections with your peers when you want to learn more about a particular project. Check out this blog post, which explores the benefits of the Library.
7. Generate reports
On the Reports tab, GRITS allows you to visualize your project impacts. On the left side of the page, you'll find many different charting options that you can use to dig further into your data. Try generating a few individual charts or use the "multiple" button that appears above the charting options to create a report containing multiple charts. Learn more in this GRITS Guide entry.

8. Build a resource use reduction scenario
GRITS Goals allows you to place your projects into the context of your institutional sustainability goals and plan how you'll achieve them. Setting up a goal is as easy as selecting the resource you're aiming to reduce, choosing a baseline, and establishing one or more resource reduction targets. From there, you can assemble pathways (what we call "scenarios") between your baseline and your target(s). This suite of features can help you develop actionable plans that your institution might otherwise pay a consultant to develop for you. Learn more about GRITS Goals in this blog post or check out this section of the GRITS Guide for a detailed explanation.
9. Schedule a meeting with decision-makers
If you're exploring GRITS during a trial period, your next step may be to make the case for a subscription to decision-makers. We're happy to support this process however we can:
- If you're unable to schedule a meeting to present GRITS to these individuals during your trial, we'll re-enable your account (including all the data you entered) so that you can present the platform during your meeting.
- We (the GRITS Team) can host a GRITS walkthrough for decision-makers at your institution.
- If you're looking for additional resources that explain the benefits of your GRITS account, please reach out to us at support@gogrits.org!
10. Establish workflows to take full advantage of GRITS' features
What workflows are needed to use GRITS effectively?
- Data collection: Familiarize yourself with the handful of data points required to create a project in GRITS and ensure that internal staff or outside contractors collect that data as part of their job.
- Data entry: You'll need at least one person who is responsible for entering project data into your GRITS account. This could be a formal member of a sustainability or facilities office, an intern, or even a contractor who is implementing your projects. Ensure that this person understands their role, knows when they're supposed to enter data, and has some training (either from a recorded walkthrough, accessible in your account via the "Need help?" button on the left margin, or by scheduling a live walkthrough with GRITS staff).
Optional:
- Data sharing/reporting: If you're using GRITS to communicate the impacts of your projects to particular stakeholders, it may be useful to specify what data you'll provide and schedule when you'll do so. If you're using one of the embeddable dashboards GRITS offers, you may need to connect with the person in charge of your institution's websites to get them situated.
- Group collaboration: If GRITS is meant to boost collaboration between different departments involved in project approval and implementation or that use project data, establish information-sharing channels and/or schedule meetings between representatives of these groups.
Can you think of any other workflows you could put in place to take full advantage of the platform's features? Consider the use cases you identified earlier.
___
If you have any questions about how GRITS can support your work, please contact the GRITS Team at support@gogrits.org.
Using GRITS to plan and track progress towards your sustainability goals
GRITS not only allows you to track your sustainability projects' impacts in one place but also to place those projects into the context of your institution's decarbonization and resource use reduction goals. A suite of planning features called GRITS Goals can help you turn your sustainability targets into actionable plans.
Creating actionable emissions, energy, water & waste reduction plans
Setting an emissions reduction target is one thing, but achieving it is another thing entirely. While planning should start from a 30,000-foot view, for your plan to be actionable you'll eventually need to determine which projects you'll undertake to achieve your target. GRITS empowers you to plan on this "action level."
As a planner, you might be setting goals across multiple buildings, identifying which projects are most impactful or provide the greatest impact per dollar invested, figuring out the investment timeline for the work involved, and more. With so much data and several moving parts to keep track of, trying to do all of this planning in spreadsheets may prove infeasible.
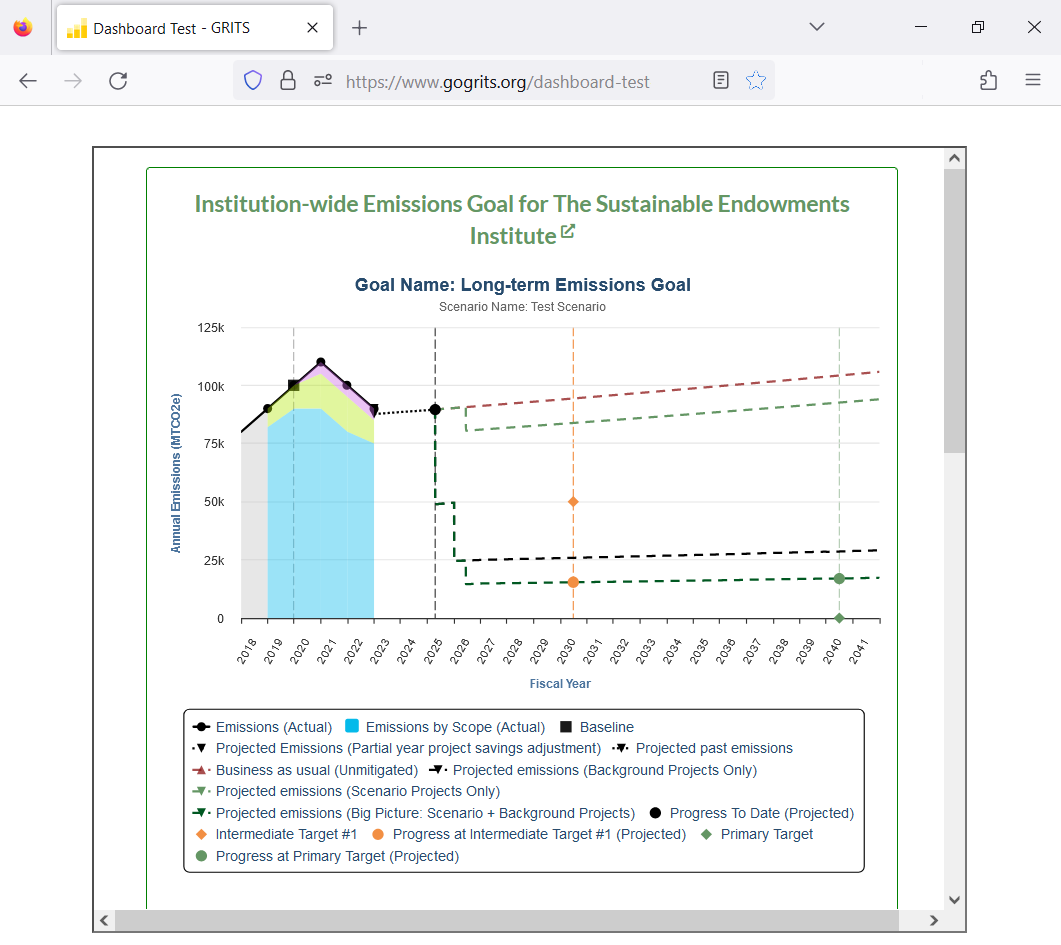
GRITS makes the process much easier. You just establish a baseline and a primary reduction target (with any number of intermediate targets in between) at either the institution-wide, campus/site, or individual building level, and then create different possible pathways (what we call "scenarios") to achieve your goal.
Quickly search through your project data to find projects that can get you a significant portion of the way to the target, and add them into your scenario. You can filter by one or more project-level attributes like annual carbon/energy/water/waste savings, cost, financial savings, return on investment, and more.
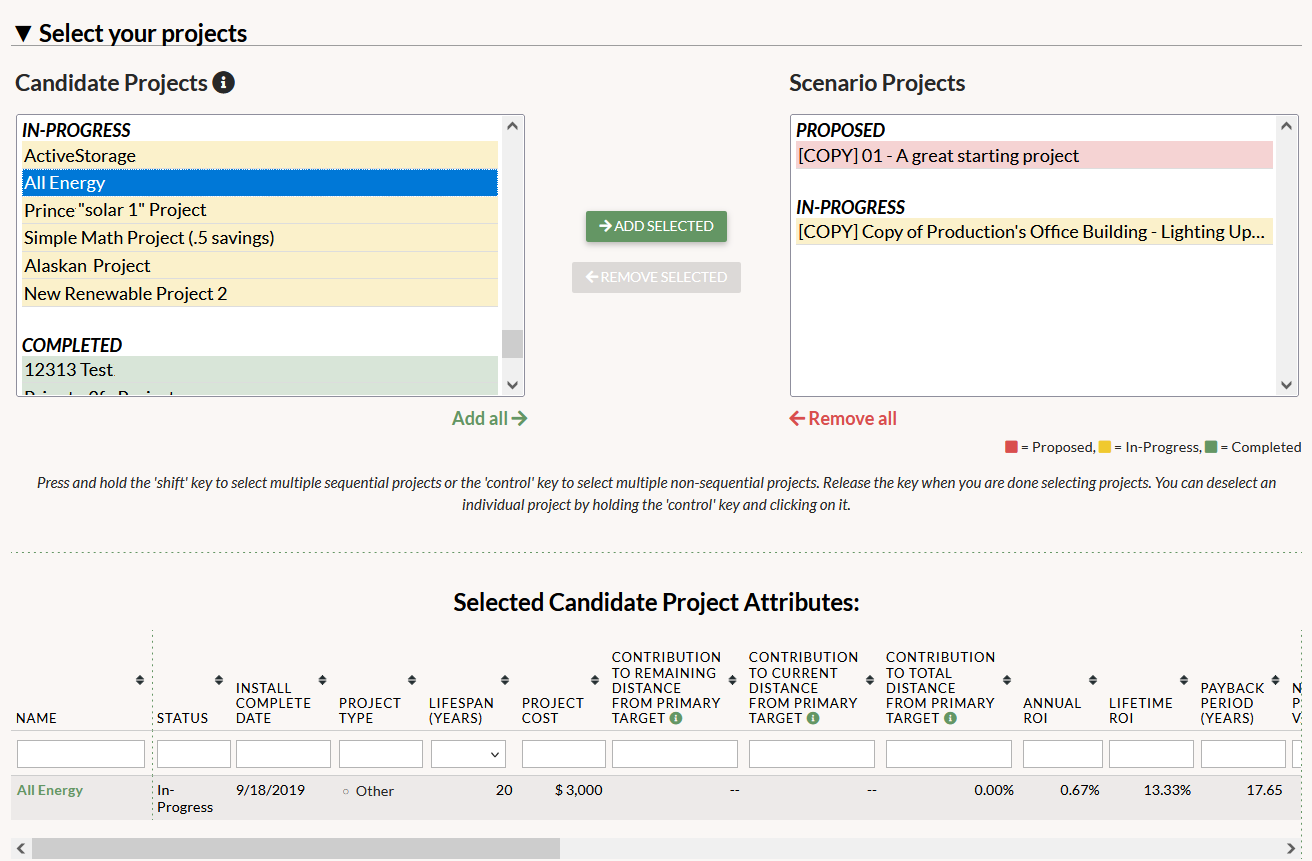
When you add projects into your scenario, GRITS will display their impact in your scenario chart. You'll see how far they get you towards your intermediate and primary targets. You can adjust your projects' implementation date to see the effect of either delaying or speeding up your timeline.
Understand and track the expected progress, costs and savings, resource reduction impacts, and financial metrics for your scenario projects
GRITS calculates the progress towards your targets that your projects are expected to achieve. You'll also see a breakdown of the anticipated emissions/energy/water/waste savings for your bundle of scenario projects and a number of financial metrics, including their payback period and return on investment.
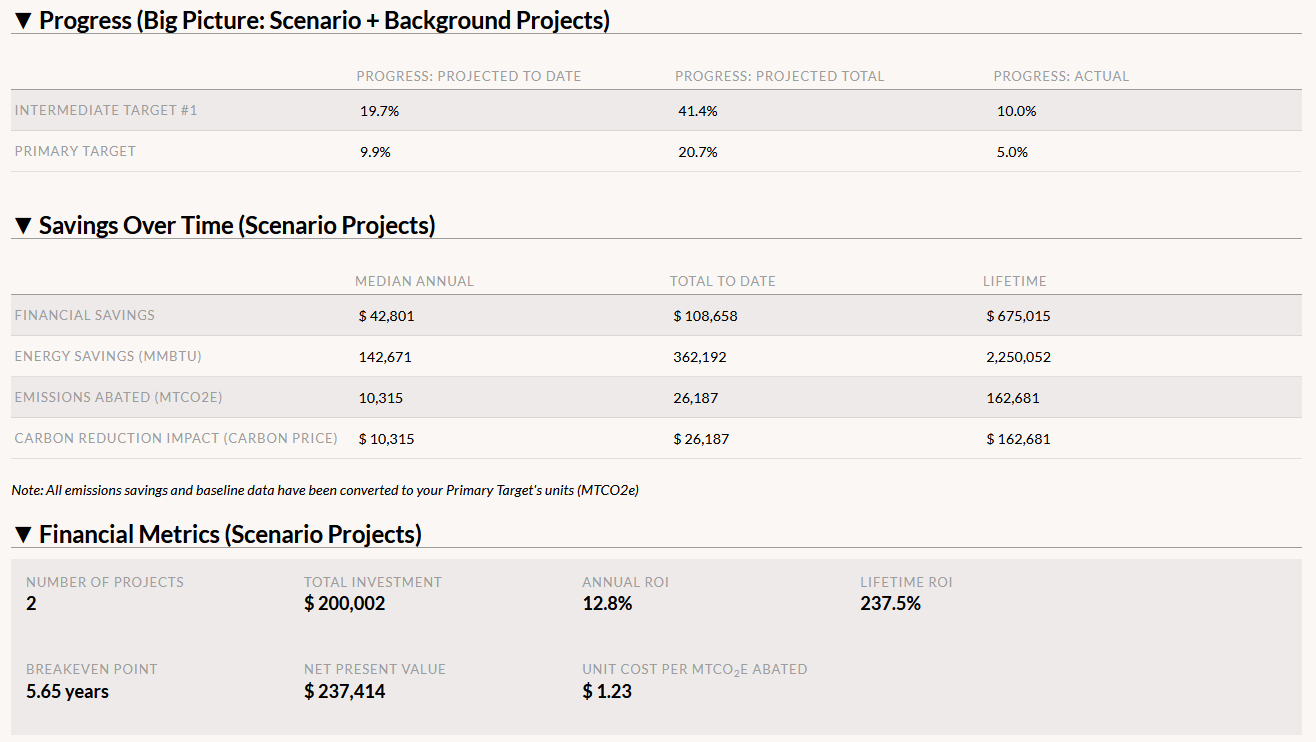
All of the projected cash flows for your scenario (both project investments and financial savings resulting from reduced resource consumption) appear in a central table.
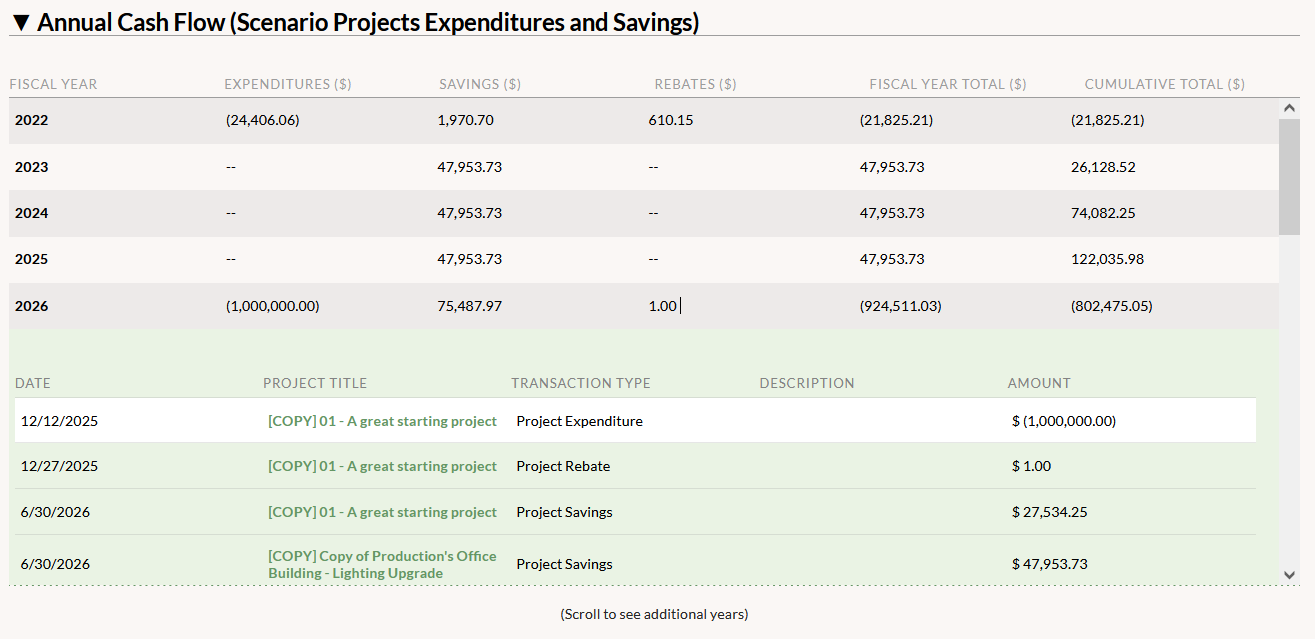
Share your plans and progress towards your goals
GRITS also makes it easy to share your scenarios. Each scenario has a custom link that you can share with others to provide access to a read-only version of the page, even if they don't have access to GRITS. You can even post it publicly to share your scenario with a wider audience.

You can also create a customized, interactive dashboard for any scenario and embed it into a webpage. Each of these sharing options will update whenever your scenario changes. Finally, you can download your scenario data into a spreadsheet to work with the numbers any way you like. (See all the sharing options GRITS provides!)
These sharing features can facilitate much more sharing of your plans with decision-makers and/or the public, and make it easier to meet any reporting requirements you have.
GRITS Goals helps you build the kind of actionable plans that you need to achieve your institution's emissions/energy/water/waste reduction targets. The platform's intuitive and standardized interface illustrates how far your scenarios get you to your goals, and can promote understanding and collaboration among different stakeholders and decision-makers. You can create as many scenarios as you need to determine the right path forward. Rather than relying entirely on third parties to plan for the future, empower your own team to do this work with GRITS.
Kicking off the Summer of GRITS - Win a prize through June 30
GRITS is designed to facilitate collaboration between different job roles and is most effectively used as a team, so to encourage more team members across different departments and offices to get involved we're kicking off a game that gives all new users (and the existing user who signed them up) a chance to win a prize!
Between today and June 30, any GRITS user who creates a new log-in for a colleague that didn't previously have access to GRITS will be entered into a drawing. If selected, that user and their colleague will each get a $50 gift card to REI or Amazon (your choice). There is one entry per new log-in created (i.e. one user can create multiple new log-ins to have multiple entries, up to a limit of 20), and one pair of users will be chosen in this drawing. The winners will be selected at random in early July and will be notified by email.
You can participate either by creating a new log-in for a colleague in GRITS (by using the "Add New Person" button on the People tab) or by filling out this form to have us create your colleague's log-in for you. (Note that only users with the Primary status level can create other new users; if you don't see the "Add New Person" button, you'll need to fill out the form to create a log-in for your colleague. We will send your colleague their log-in credentials in an email along with a brief description of this drawing and CC you.)
If you have any questions, please let us know at support@gogrits.org. Here's to teaming up in GRITS!
Thank you,
The GRITS Team
User Reflections for the 10th Anniversary of GRITS
As we celebrate the 10th anniversary of the launch of GRITS (check out a decade of GRITS development milestones here), we reached out to users to hear about how the platform has supported their efforts to reduce energy, emissions, water, waste, and utility costs in their buildings. Here are a few reflections we received:
"GRITS has helped my team develop a project portfolio and develop reports to justify funding requests. . . My team typically looks through other similar organizations (Higher Ed, Healthcare) to determine if there are any projects that match our existing problems/needs. We can use actual figures to then justify feasibility studies and costing. . . Being able to clearly showcase reduction, ROI, cashflows, etc. for a complex group of stakeholders and administrators allows my team to demonstrate the value of our work."
- Joe Dizon, Energy Manager, University of California San Diego Health
"We have used the embedded code on our sustainability website to report on particular projects. This has been very well received by the marketing and media teams. . . Reporting on sustainability metrics using GRITS helps us guard against greenwashing."
- Libby Hogarth, Environmental Project Officer, University of Adelaide
"It has helped us keep an account of our project savings that makes reporting easier."
- Brian Sewell, State Energy Management Program Coordinator, State of Vermont
"Being in the city of Boston, we have used the calculations to help take into account future BERDO fines as a way to improve our ROI. . . the goals tab makes it extremely easy to show how much progress we have made and how much more we can do." (Learn more about Boston's building performance standards policy BERDO here.)
- Jennifer Bleecker, Energy Efficiency Program Manager, Boston University
"GRITS is the primary tool to manage our GRF. GRITS provides the financial data for us to report on the status of the GRF."
- Anthony Ferraro, Energy Efficiency & Renewable Energy Manger, University of Dayton
"GRITS allows us to track, share and archive information and files related to our conservation projects, so it has completely replaced our old database without the previous coding and administrative management burdens."
- David Larson, Energy Engineer, Brown University
"GRITS has made my job easier since without it the tracking process would be much harder and I would be forced to figure out some other way to integrate all data on one place. As a data manager in our company I realize how important is to have a software product such as GRITS."
- Nikola Janjic, Energy Management Intern, School of Visual Arts
GRITS 10th Anniversary Celebration
Dear GRITS Community,
This week marks the 10th anniversary of the launch of GRITS. Way back on Earth Day in 2014 we unveiled the initial version of GRITS as a new solution to help sustainability and energy teams accelerate their institution’s work towards greater energy efficiency and decarbonization goals.
It has been an incredible journey building out the platform’s functionality and growing the community of GRITS users. The guidance, encouragement and support we’ve received from this community have been absolutely essential in making the journey a success, and GRITS definitely wouldn’t exist without all of you. Did you know that nearly 90% of the functionality that users rely on today didn’t yet exist in GRITS 1.0 when we launched the platform a decade ago? The vast majority of new features were added because of input from both current and prospective users and through fun feedback competitions like the GRITS Gold Medal Challenge we ran to coincide with the 2022 Olympic Games.
Below you’ll find a timeline that spotlights a small selection of our milestones over the years.
We want to take a moment to specifically thank many of our original users who are still tracking their work in GRITS 10 years later: Boston University, Colgate University, Dickinson College, Lane Community College, Luther College, Spelman College, the State of Vermont, Thompson Rivers University, University of Michigan, University of New Hampshire, University of Vermont, Western Michigan University and Williams College.
We’re also grateful for the terrific partner organizations within the GRITS community—APPA, NYSERDA, Second Nature, SIMAP and USDN—that have allowed GRITS to reach a much wider range of institutions.
As we celebrate this milestone, we also want to recognize and deeply thank all of the current and past team members who have worked on GRITS over the past decade. Developing and managing GRITS is a huge effort and we are fortunate to have a world-class team that cares deeply about making an impact in the fight against climate change.
To help celebrate this 10th anniversary year we have many exciting new features planned, so look for announcements about these features in the coming months. And please keep the feedback and suggestions for improvement coming, as we’re always interested in hearing from our current and prospective users. (You can check out feedback that we've collected from GRITS users for the 10th anniversary celebration here.)
Thank you so much for being part of the GRITS community. We look forward to continuing to work together to help you reach your institution’s energy, sustainability and decarbonization goals!
Onward!
Mark, Aaron, Arvel, Deb and the whole GRITS Team
Using GRITS to Manage a Green Revolving Fund
GRITS is the only platform designed to help institutions track both the project investments and repayments involved when running a green revolving fund (GRF).
While most GRITS users don't finance their sustainability projects through a GRF, those who do have additional features designed specifically to simplify the accounting required (check out a recorded training focused on these GRF features).
Easily keep track of fund balances, investments, and financial savings
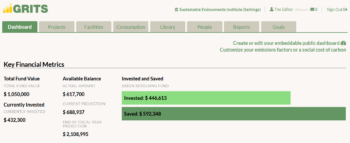
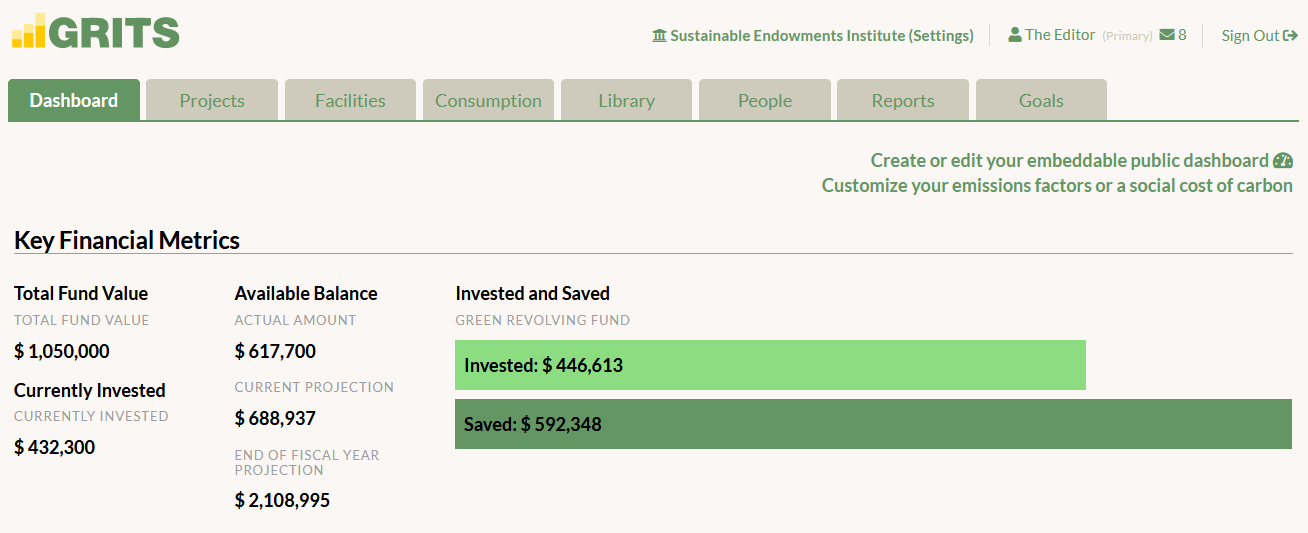
There are a number of figures that a GRF manager must keep track of: the total fund value, the balance available to be invested in new projects, and the outstanding amount currently invested in completed projects that are in their payback phase. GRITS helps you keep track of all three figures.
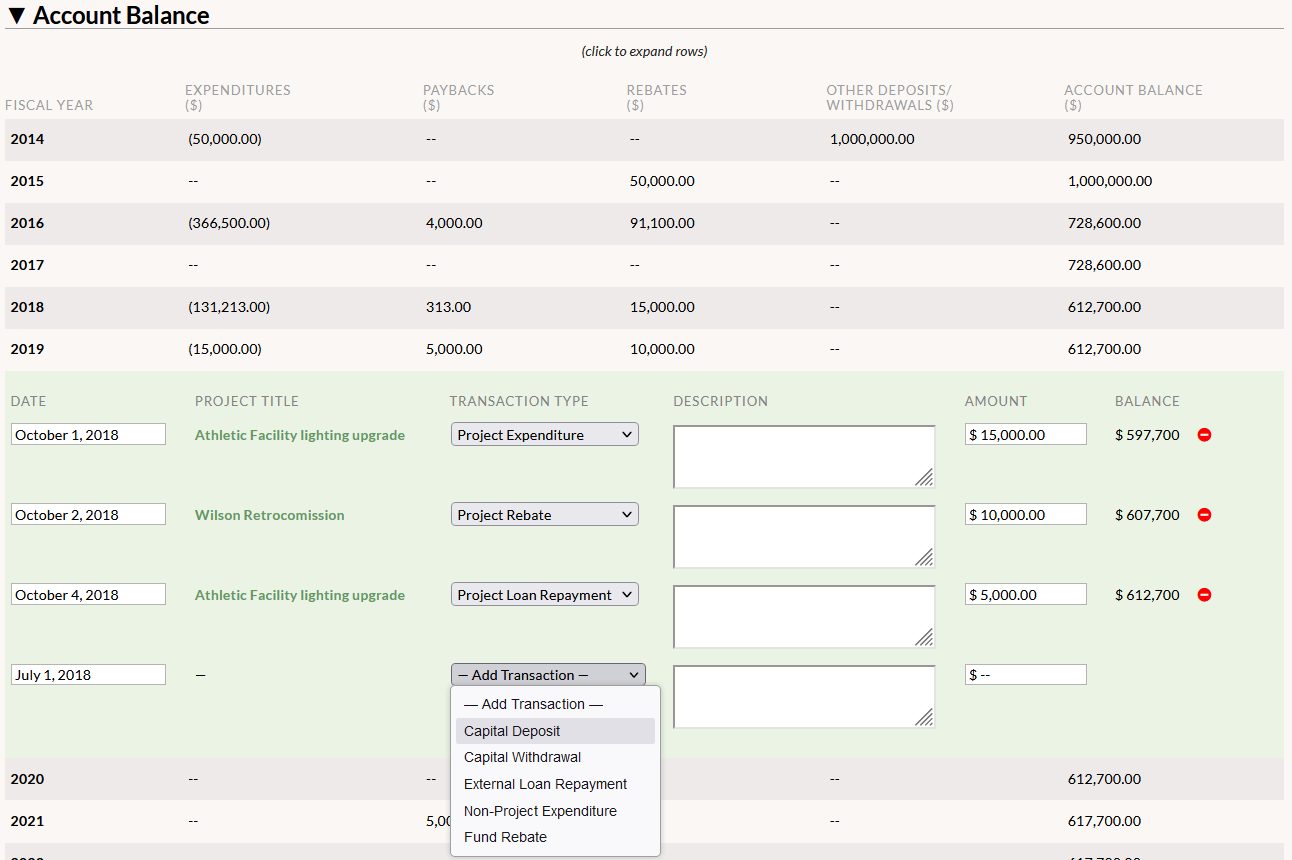
You can set your total fund value and adjust it whenever it grows (due to donations or other sources) or shrinks (if the fund was itself seeded with a loan requiring repayment, for example). You can find more information about fund-level transactions below.
Each project-level transaction you enter, whether an expenditure, repayment, or even a rebate, will automatically recalculate the available balance and outstanding loan amounts for your fund.
GRITS also calculates two projections for you: 1) the fund balance as of today if all project loan repayments were made daily, and 2) the fund balance at the end of the fiscal year, with all anticipated loan repayments factored in. These projections can help you plan for your next round of project investments.
Lastly, you'll see a tally of the amount of money invested in projects to date as well as the cumulative financial savings achieved by those projects to date.
See all GRF cash flows in one place
You can enter transactions at the fund level and at the level of individual projects. All of those transactions are organized in one place, so that you can easily keep track of all cash flows associated with your GRF.
Learn more about establishing your total fund value and other fund-level transactions here.
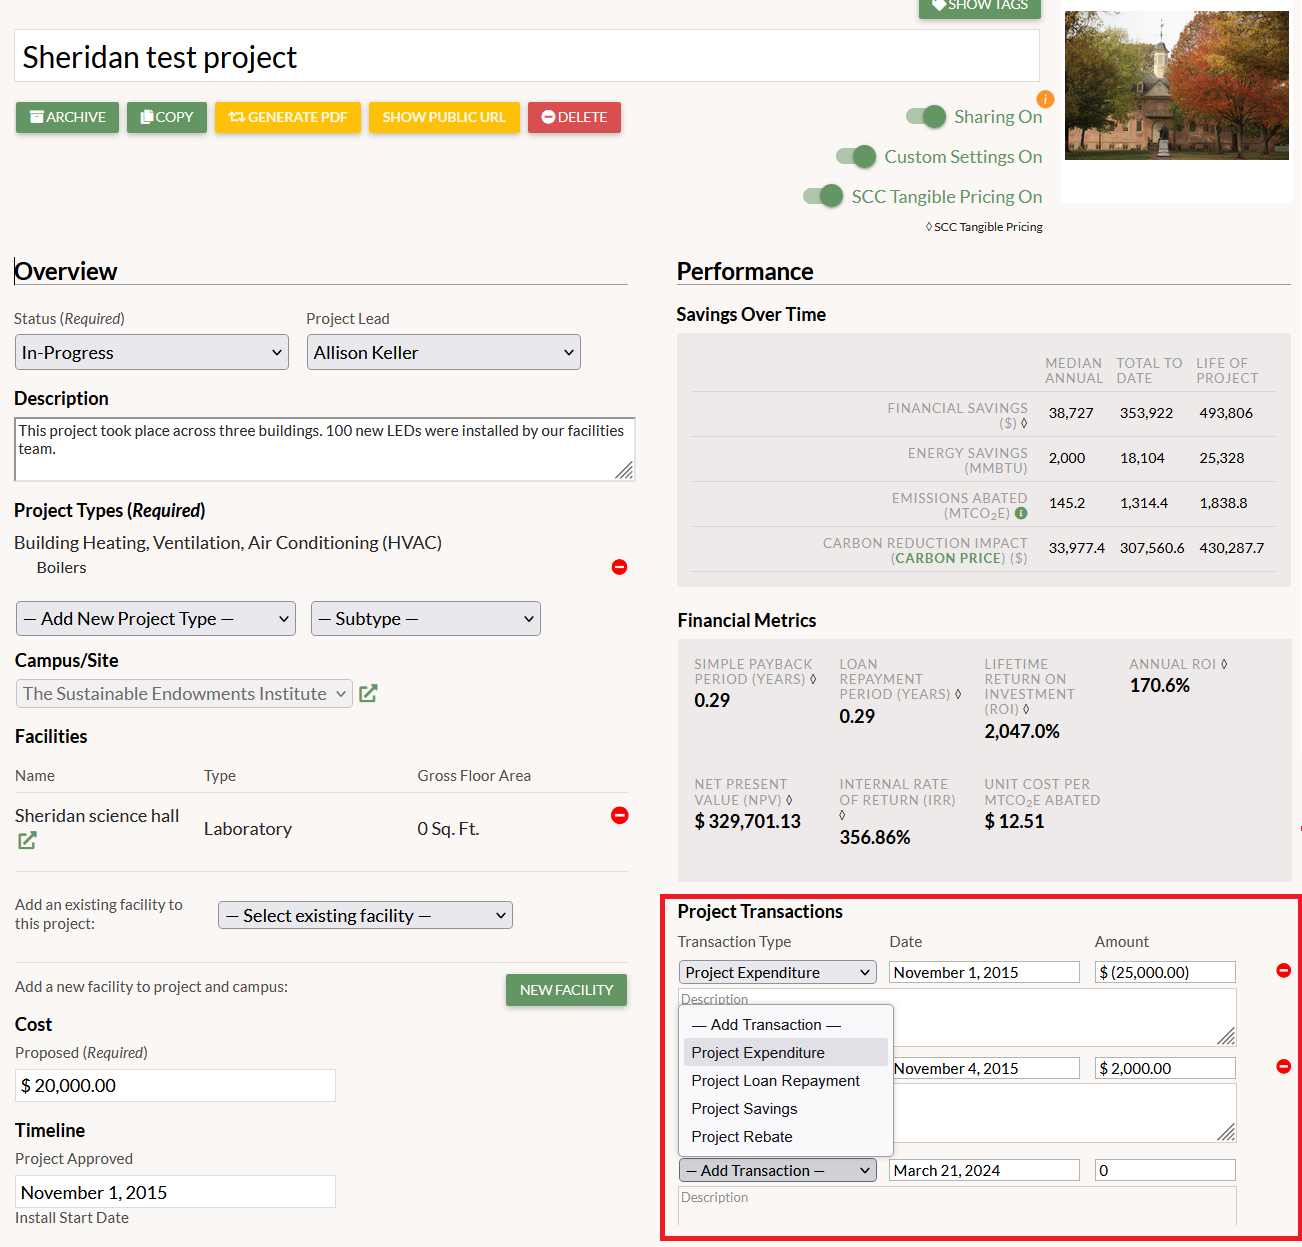
Learn more about project-related transactions here.

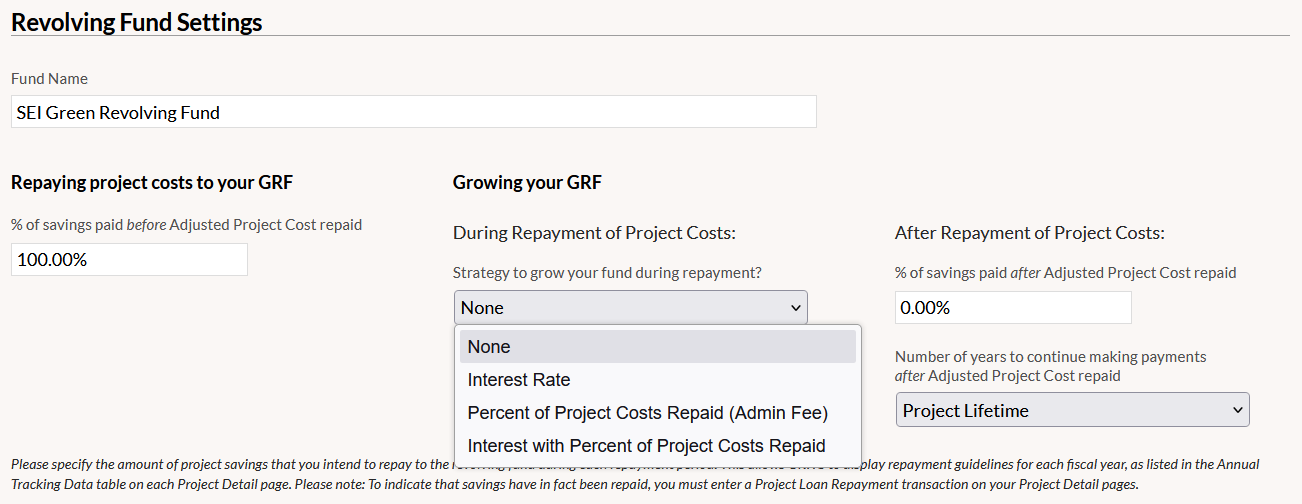
Set your GRF repayment guidelines, and GRITS will calculate the payback schedule for every project
GRITS allows you to specify the percentage of savings you'll repay to your GRF for each repayment period. If you plan to grow your GRF over time, you can also indicate which strategy you're using: charging an interest rate on the outstanding project loan, planning to pay back extra savings based on the project cost (say, 110% of the cost rather than 100%), or continuing to pay back a certain percentage of savings (say 20%) for a period of time after the project cost has been repaid. These repayment guidelines allow GRITS to calculate a payback schedule for each of your projects.
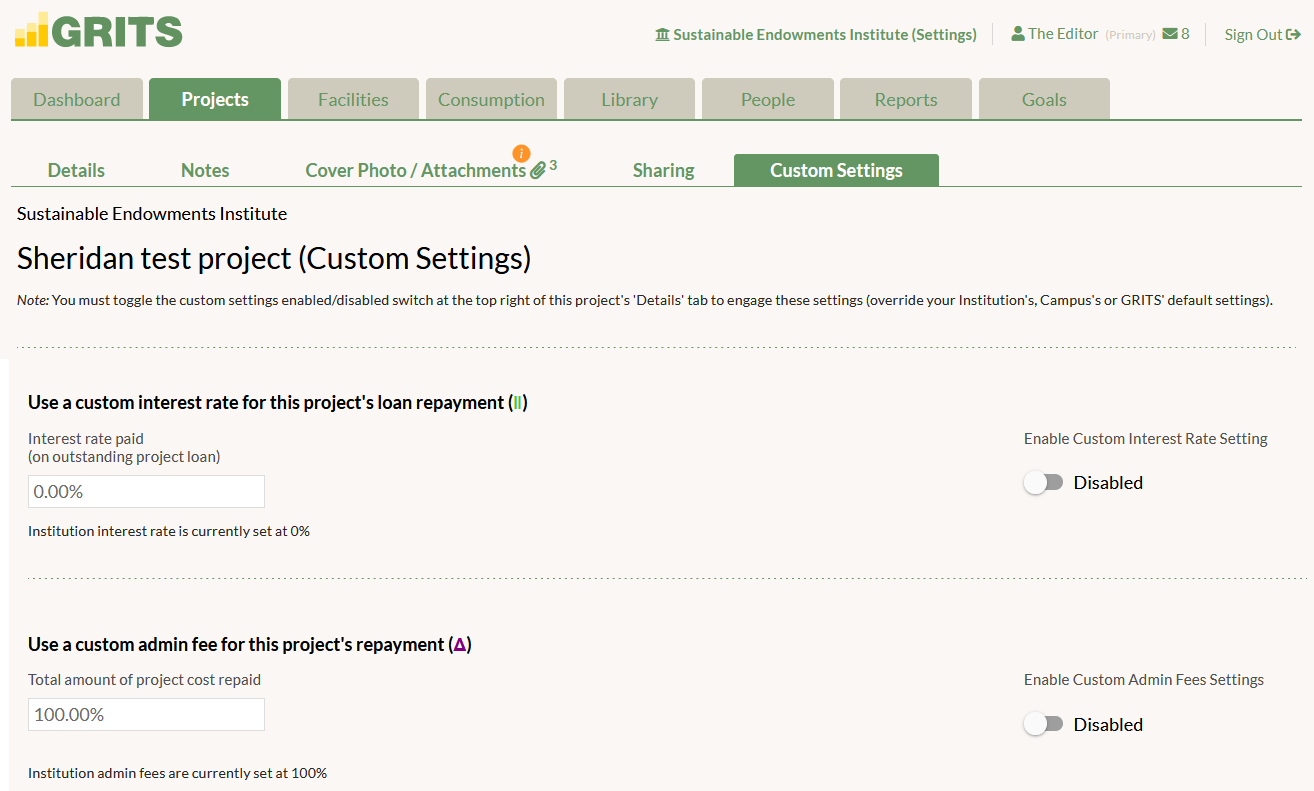
If you grow your GRF over time by charging an interest rate or by planning to pay back an extra percentage of the project cost, you can customize those rates for individual projects.
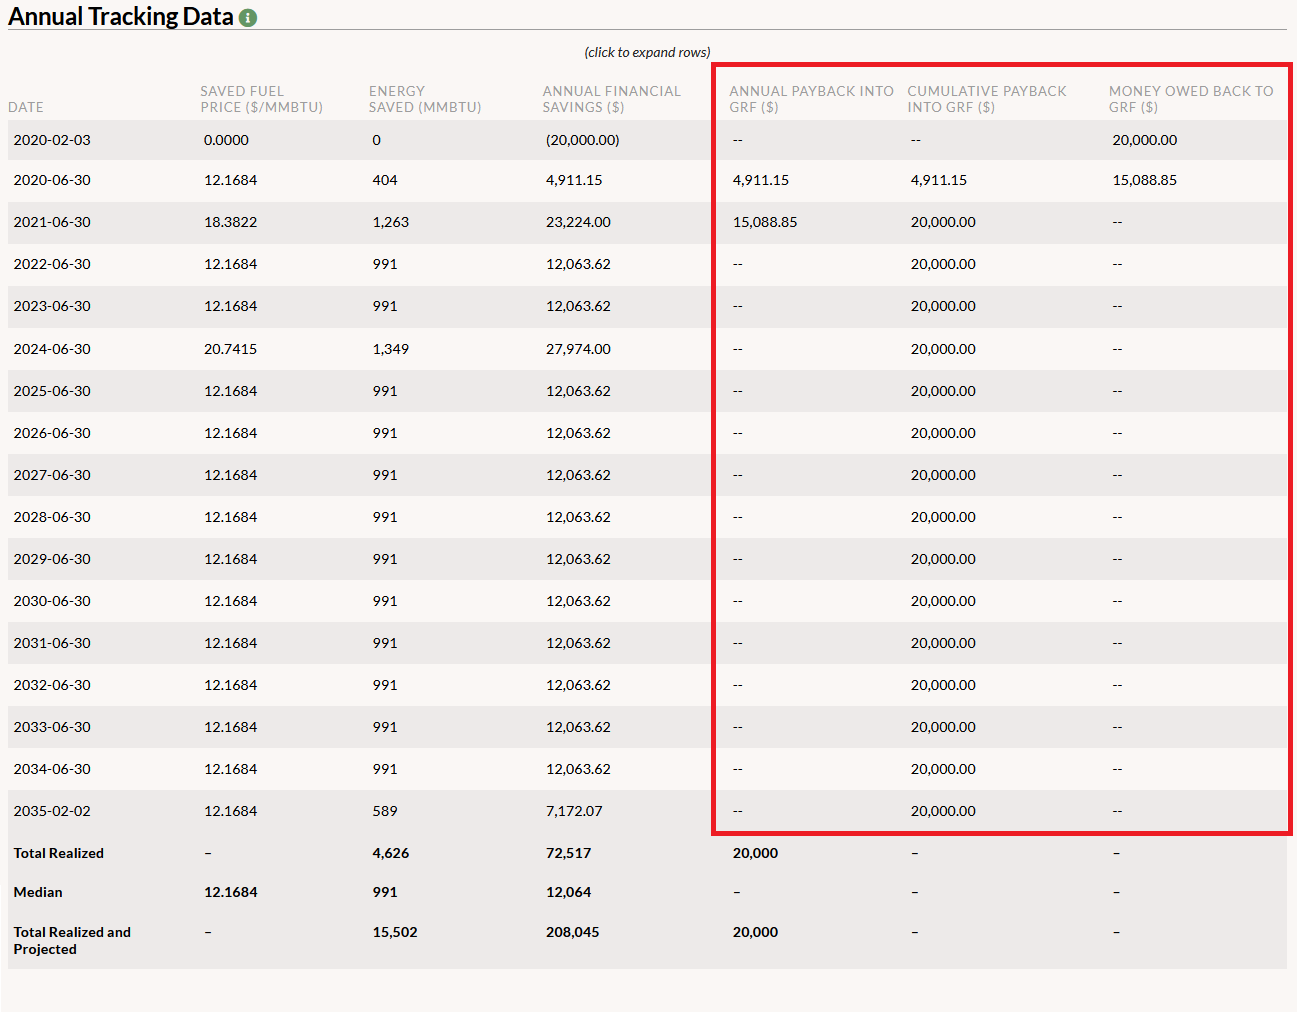
Each of your projects has an "Annual Tracking Data" table that displays both the projected financial savings for each fiscal year of the project's lifespan and the payback schedule you should follow to adhere to your GRF's repayment guidelines. All mechanisms used to grow the fund are factored into these calculations, as well as any updates made to resource prices or unit savings in any fiscal year.
Ultimately, you can customize the project loan repayment transactions you enter to match your actual cash flows, even if they differ from the schedule provided by GRITS. If you perform multiple repayments each year or you decide to repay a different portion of a project's accrued savings, you can indicate that. Based on these transactions, GRITS keeps track of the outstanding loan balance for each project.
___
In addition to these GRF accounting features, GRITS provides much more functionality designed to support your efforts to reduce emissions and resource consumption. The platform calculates a host of project-level and portfolio-wide impact metrics (see which metrics GRITS calculates for you!) and offers several ways to communicate those impacts with others (see all the sharing options GRITS provides!).
If you're looking for additional GRF resources, you can check out our survey of institutions across the United States with a GRF. It discusses common fund operating procedures, explores their benefits, and addresses commonly perceived barriers to getting started--including a section on GRF accounting. An appendix lists additional resources for learning more about GRFs and ways to establish one within your institution.
Interested in learning more about GRITS? You can check out a recorded training focused on the GRF features described above. Or contact us!

Learn from, Connect with, and Inspire Others through the GRITS Project Library
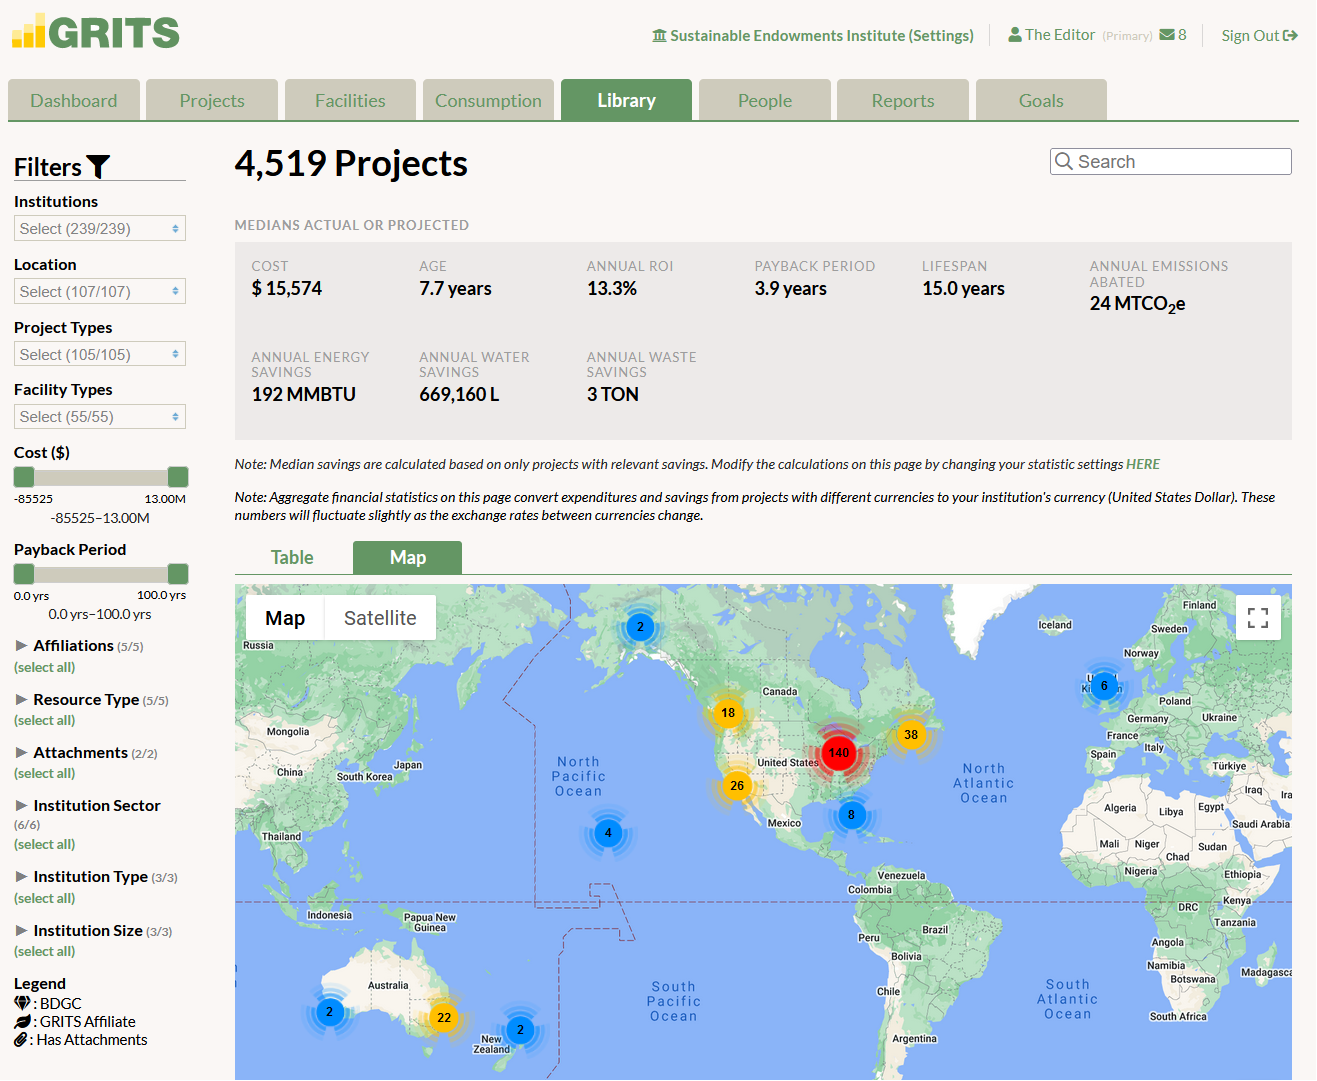
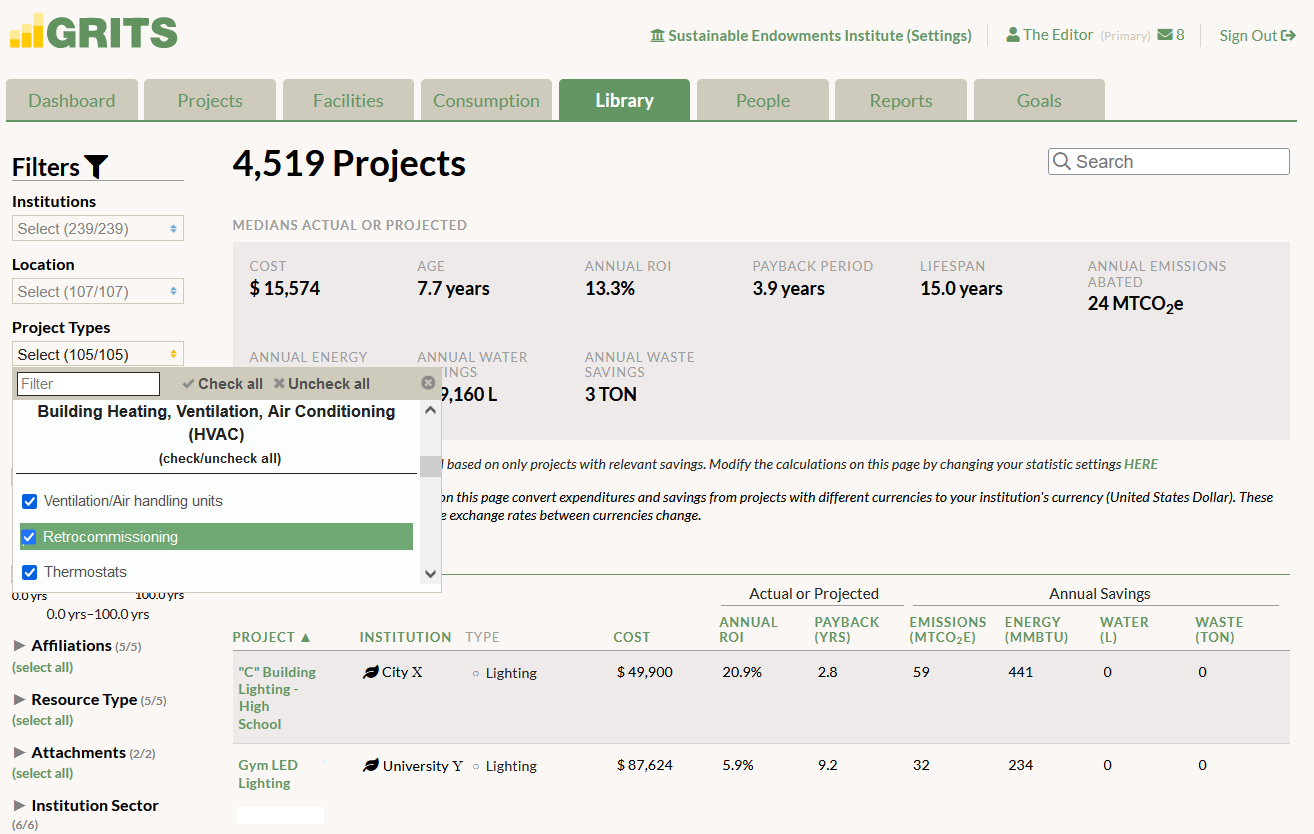
The GRITS Project Library is a unique resource that currently features over 4,500 completed projects from GRITS users around the world. You won't find a richer source of real-world energy efficiency and renewable energy project data elsewhere.
Non-profit institutions that choose to participate in the GRITS Library can see these projects and contribute their own. What can you do with access to the Library?
Compare your project data against others'
Maybe you've recently completed an HVAC project and want to understand how it compares to HVAC projects in other places but within the same kind of building (office, classroom, etc.). You might be curious whether you're paying an appropriate price for a multi-building lighting retrofit. Perhaps you want to know whether nearby institutions have received a rebate for their lighting upgrades.
All of this information is available in the GRITS Project Library. You'll also be able to review the documentation that other GRITS users have attached to their projects and decided to share (e.g. requests for proposals, project blueprints, before and after photos).
See what peer institutions are working on
If you have one or more peer institutions that tend to influence your work or whose actions motivate project decision-makers at your institution, you can follow them in the Library. Filter for projects from a specific institution or a particular geographic location.
Get inspiration for new projects
Institutions around the world are constantly working to reduce resource consumption and carbon emissions in their facilities. They might be working with equipment or materials or in a particular type of building that you haven't explored during your own efforts. Have you wondered how much energy a new boiler could save? Check out the Library!
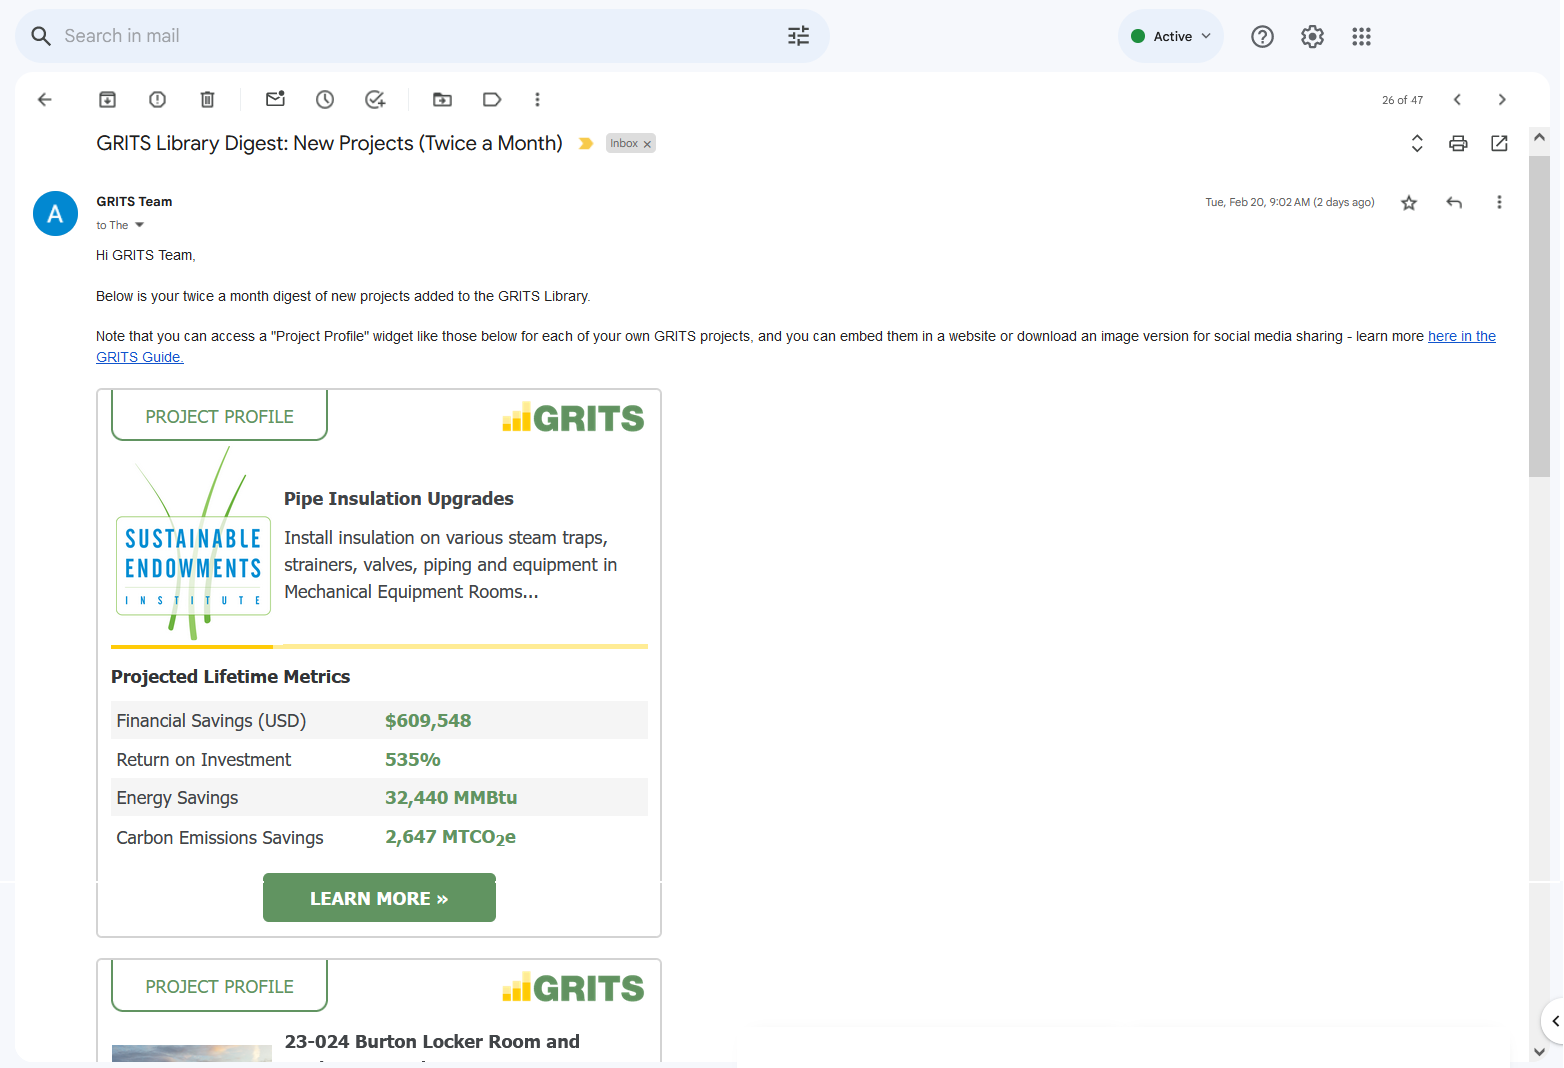
Those with access to the GRITS Library receive the Library Digest, a biweekly email that displays the latest projects completed by GRITS users. Get project inspiration delivered to your inbox!
(Note: The Project Profile widgets that appear in the Library Digest email, like the example pictured below, are available for each of your own projects. They can be embedded in your institution's website or downloaded for social media sharing.)
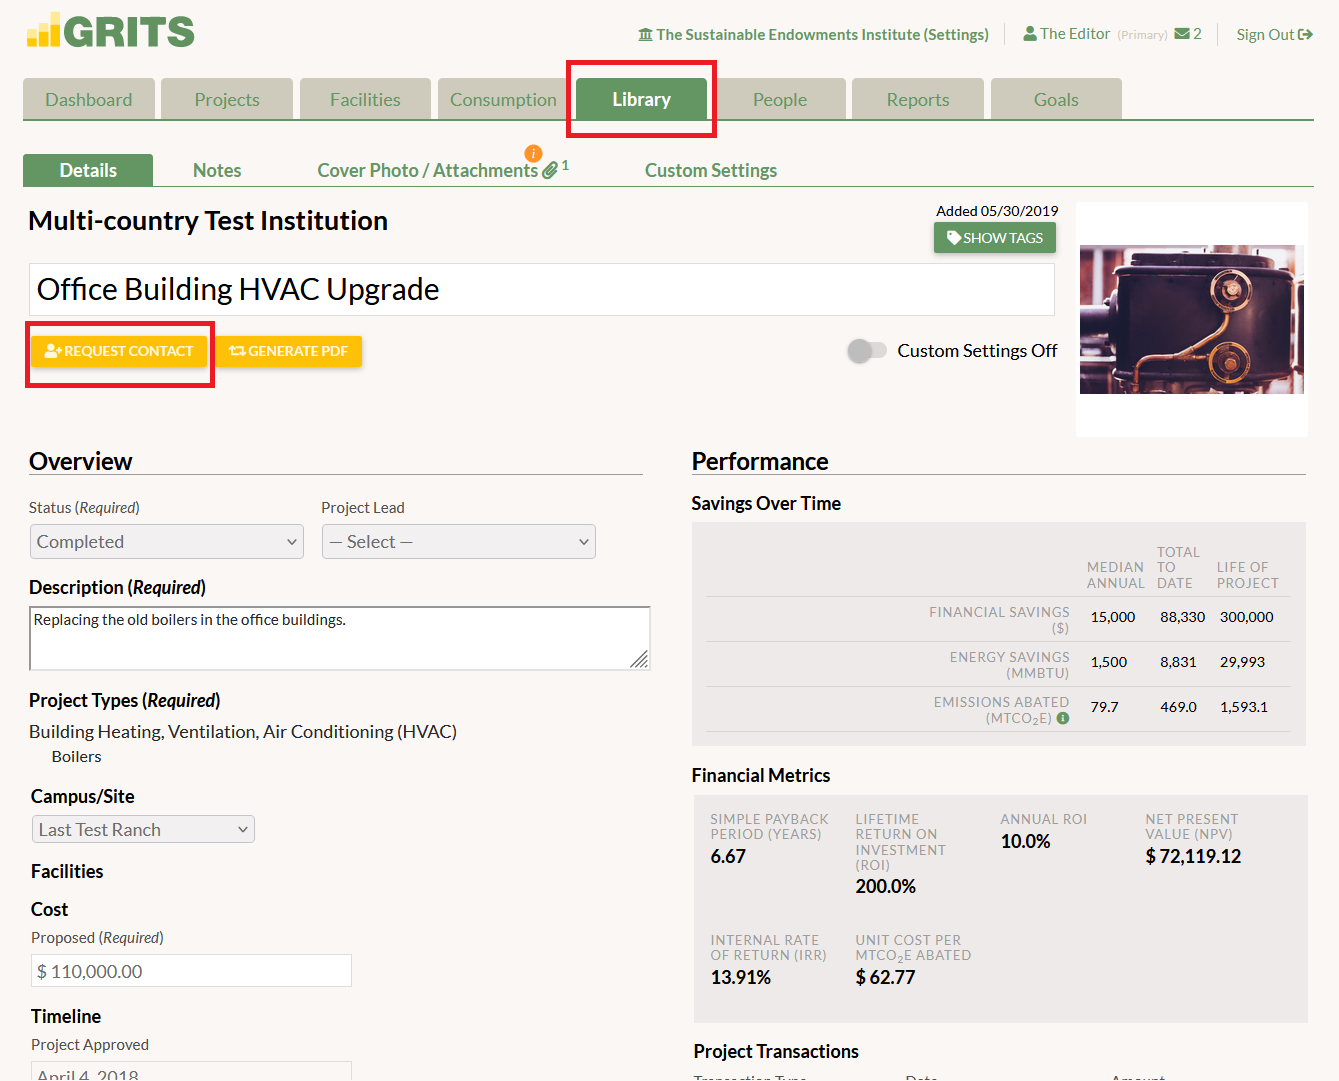
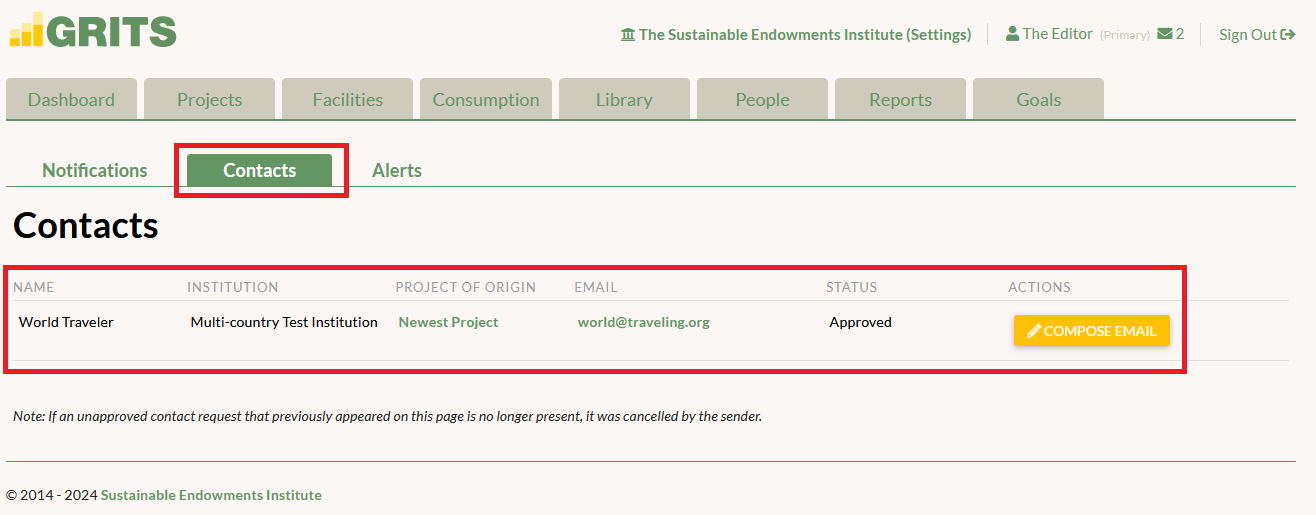
Connect with your peers via GRITS Connect
Once you've found an interesting project that you'd like to know more about, you can use the "GRITS Connect" feature to reach out to the user who added it. GRITS will send a connection request to that user, and if they accept, the platform will send an email introduction to both of you.
 Share your work with others
Another benefit of participating in the GRITS Library is that you can contribute to a unique learning resource used by other sustainability and facilities professionals around the world. Boost the impact of your work by sharing your project insights with thousands of other GRITS users. And raise the profile of your institution and its resource use reduction efforts in the process!
___
Not a GRITS user? Check out the GRITS Public Library
If your institution doesn't have a GRITS account, you can get a taste of the full Project Library by exploring the GRITS Public Library here: https://app.gogrits.org/
The Public Library features a selection of projects from the full Library that users have chosen to share with the world.
To recap, the GRITS Project Library allows you to:
- Compare your project data against others' (what you're saving, how much you're paying, relevant rebate opportunities, publicly available documentation, etc.)
- See what peer institutions are working on
- Get inspiration for new projects
- Connect with others via GRITS Connect
- Share your work with others (See all the sharing options GRITS provides!)
Getting Out of Spreadsheets with GRITS
For those whose job involves planning or installing projects that reduce resource consumption or carbon emissions, spreadsheets are a commonly used tool for organizing the data involved. They're certainly better than written notes or documents, or not tracking project-related data at all. But they pose a number of challenges that can drain your time (and patience). Using GRITS to track your project data and your resource use reduction targets helps you leave spreadsheets behind.
___
Project-level and portfolio-wide impact metrics calculated with minimal data entry
Spreadsheets: Initially setting up a spreadsheet to calculate project impacts takes a lot of work. Just informing oneself about meaningful metrics to track takes time. More time is needed if additional datasets are required to perform a calculation, like finding emissions factors in order to determine the carbon savings from your energy efficiency projects. And learning how to set up special equations in the formats required by the spreadsheet can feel like learning a foreign language.
GRITS: Numerous meaningful project impact metrics are built into the platform and calculated from a handful of details about each project. Easily track the energy, financial, and carbon savings of individual projects and your whole portfolio. Learn more about the metrics GRITS calculates for you!
Easy-to-use interface & numerous forms of live and self-guided user support
Spreadsheets: Once a spreadsheet is set up, it may not be intuitive to others. Teaching colleagues how to use it can take significant time.
GRITS: GRITS's intuitive and standardized interface facilitates collaboration between different departments (even those not well-versed in facilities work). Access to your online account can be provided to an unlimited number of people.
Numerous support options make it easy to get started with GRITS, including direct calls and emails with support staff, a live chat feature in the platform, numerous self-paced in-app tours, recorded walkthroughs, and a comprehensive GRITS Guide. A live GRITS walkthrough takes an hour or less, and a project can be created in a couple minutes.
Protection against corrupted files, with editor or read-only access levels for each user & a central location for all of your project data
Spreadsheets: Keeping track of hundreds of projects across dozens of buildings isn't always easy. If different spreadsheets are used to capture different kinds of data, compiling everything can be time-consuming. The potential for data entry mistakes only increases with the number of projects and spreadsheet collaborators. The worst-case scenario is when a file that hasn't been backed up becomes corrupted and unusable after lots of effort has been put into it.
GRITS: Tracking project data with GRITS eliminates the risk of corrupted files and can reduce data mistakes. Each password-protected user log-in can be specified with either editor or viewer (read-only) access, so that only those who should be able to add and edit project data are able to do so.
With GRITS, all of your project data lives in one central location. This includes a cash flow table that aggregates each project-level expenditure or rebate you enter, which becomes extra useful if your institution finances projects through a green revolving fund. You can upload all documentation relevant to each project, including requests for proposals, signed contracts, project blueprints, and before and after photos.
Several data sharing features to communicate the impacts of your projects and comply with reporting requirements
Spreadsheets: Sharing the insights contained in a spreadsheet with decision-makers who aren't familiar with it requires its own learning curve. Even after data has been collected and project impact metrics are getting calculated, you still need to figure out how to build charts and other visuals from your data. Spreadsheets don't allow for dynamic or interactive charts, limiting the options you have to illustrate your work.
GRITS: GRITS has several sharing features that make it easy to communicate the impacts of your projects with others and facilitate compliance with reporting requirements. Generate charts of your project impacts or embed interactive dashboards into your institution's websites. See all the sharing options GRITS provides!
Easier staff transitions
Spreadsheets: When all of your institution's project data lives in a spreadsheet, staff transitions can get messy. Departing staff need to set aside time to teach new hires about how the sheet works. If that knowledge transfer doesn't happen, it can sideline an institution's ability to keep track of its projects.
GRITS: GRITS eases staff transitions with its intuitive interface, short learning curve, and support professionals available to provide training and assist new users with any questions they have.
 ___
___
GRITS has many advantages over spreadsheets. It's likely to save you and your team a lot of time and frustration. It offers even more advantages if your institution hasn't been keeping track of its project data at all. By entering this data into GRITS you'll get a better understanding of your projects' impacts, which can help justify the important benefits that project planners and installers (facilities staff, energy managers, etc.) bring to your institution.
To recap the main points, GRITS offers:
- Project-level and portfolio-wide impact metrics calculated with minimal data entry. See which metrics GRITS calculates for you!
- An intuitive and standardized interface.
- Numerous forms of live and self-guided user support.
-
Protection against corrupted files and data mistakes, with editor or read-only access levels for each user.
-
A central location for all of your project data, including all relevant documentation.
- Several data sharing features to communicate the impacts of your projects and comply with reporting requirements. See all the sharing options GRITS provides!
- Easier staff transitions.

Using GRITS to Analyze the Impacts of Your Projects
One of the major ways GRITS can support your work is by helping you understand the energy, financial, and carbon savings of your sustainability projects. Perhaps your institution has never consistently tracked the impacts of your projects. Or maybe you're keeping track of some project details in a spreadsheet, but lacking many of the metrics you'd like to know. That's where GRITS can make a big difference.
The platform generates and presents three kinds of impact data: project-level, portfolio-wide, and illustrated reports.
Project-level
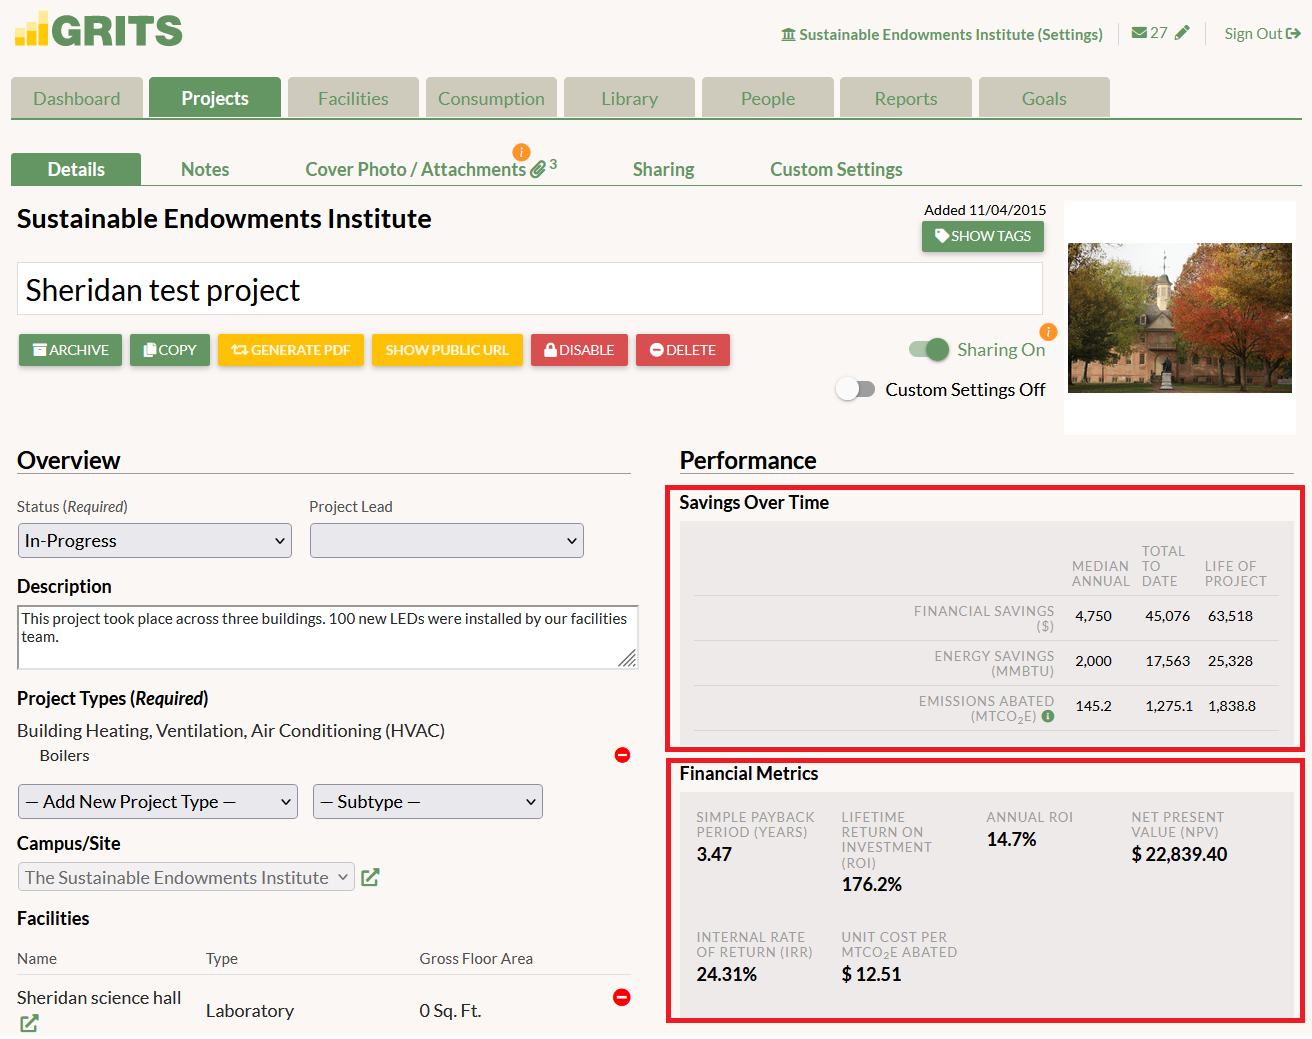
Each project you enter has its own impact calculations--check it out.
GRITS calculates each project's financial, energy, carbon emissions, water, and waste savings, breaking them out into three categories: median annual savings, total to date savings, and lifetime savings (over the course of the new equipment's lifespan).
GRITS also calculates a number of financial metrics that allow you to evaluate the project's effectiveness as an investment. These include the payback period, annual and lifetime return on investment (ROI), net present value (NPV), internal rate of return (IRR), and unit cost per MTCO2e abated.
And to get all of these calculations, you only need to enter a handful of data points for a project (or use our spreadsheet upload option to add multiple projects at the same time).
You can also easily customize these calculations in several ways:
- You're able to update the price of a saved resource or the actual amount saved (e.g. if utility meters are in place) in any fiscal year, and when you do, all of these calculations update automatically.
- Does your institution use different electricity emissions factors than others in your area? GRITS lets you customize your emissions factors for electricity and a number of other resources to ensure your carbon emissions savings calculations are accurate.
- Does your institution apply a social cost of carbon (SCC) or carbon price to your emissions? If so, you can enter your SCC framework into GRITS and have the platform calculate the "carbon reduction impact" (i.e. the avoided damages in dollar terms resulting from reduced emissions) for each project. You can even formally incorporate the carbon reduction impact into your projects' financial savings.
- GRITS also allows you to apply resource price forecasts to your projects to see how your financial savings would increase if utility prices rise.
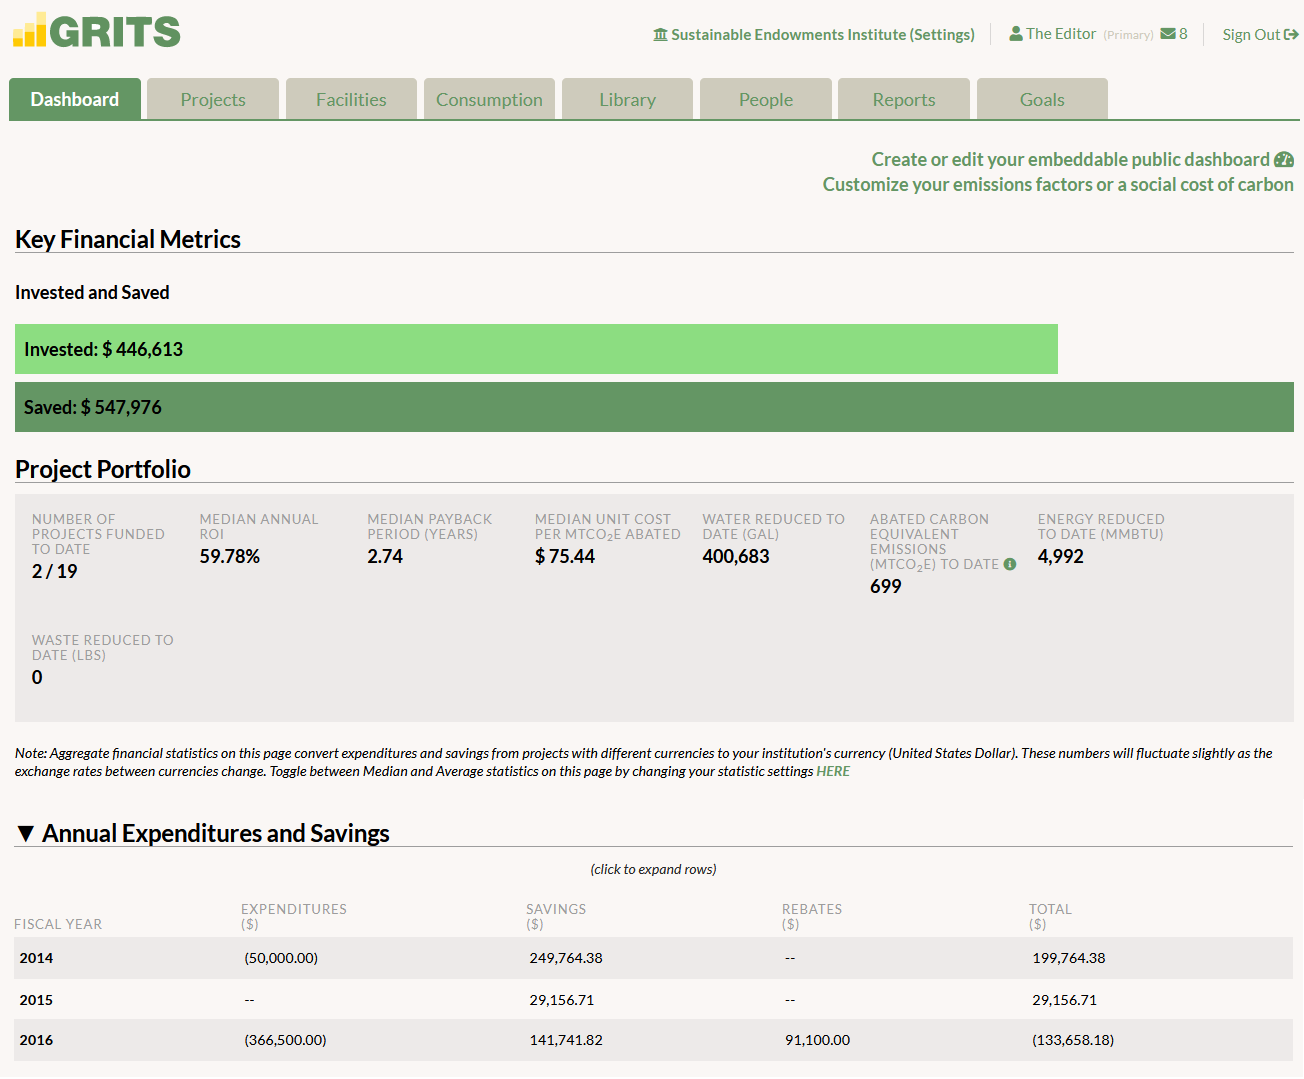
Portfolio-wide
GRITS aggregates your project data, allowing you to evaluate your entire portfolio or just a specific piece of it. Most of these metrics match those calculated for each individual project (e.g. median annual/to-date/lifetime savings across avoided costs/energy/emissions/water/
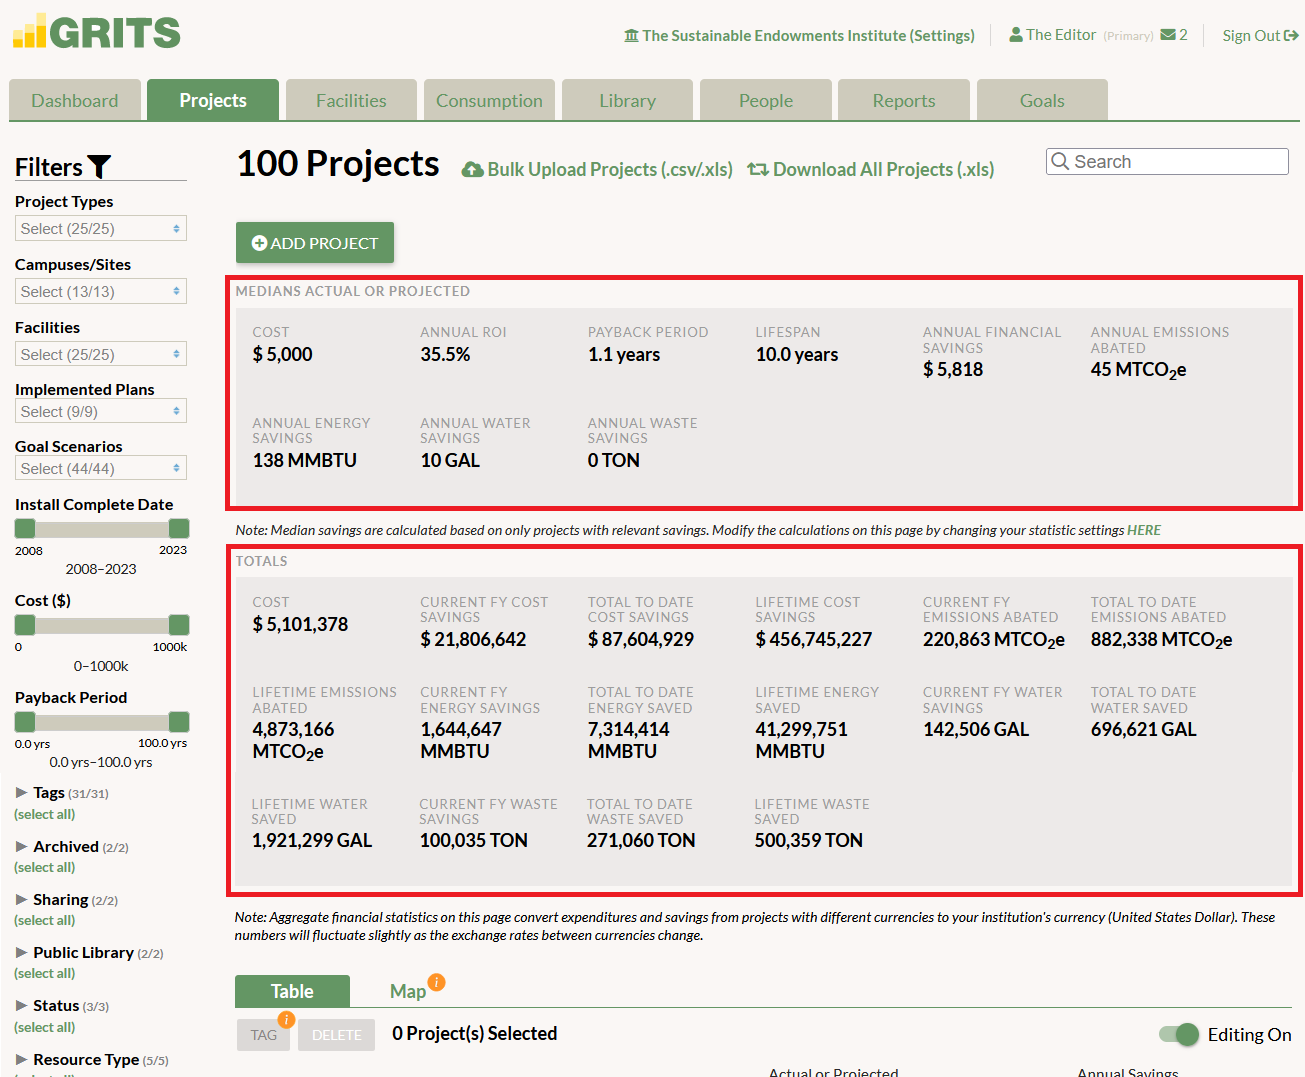
You can dive further into your data through numerous filters. Only want to see the impacts of your completed projects? Or perhaps you're currently interested in the anticipated impacts of proposed projects. Filter by project type (e.g. lighting, HVAC, renewable energy, etc.), campus/site, facility, cost, and many more options--even create your own custom filter.
Illustrated reports
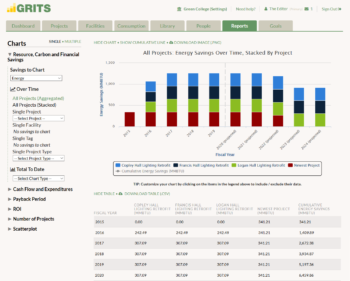
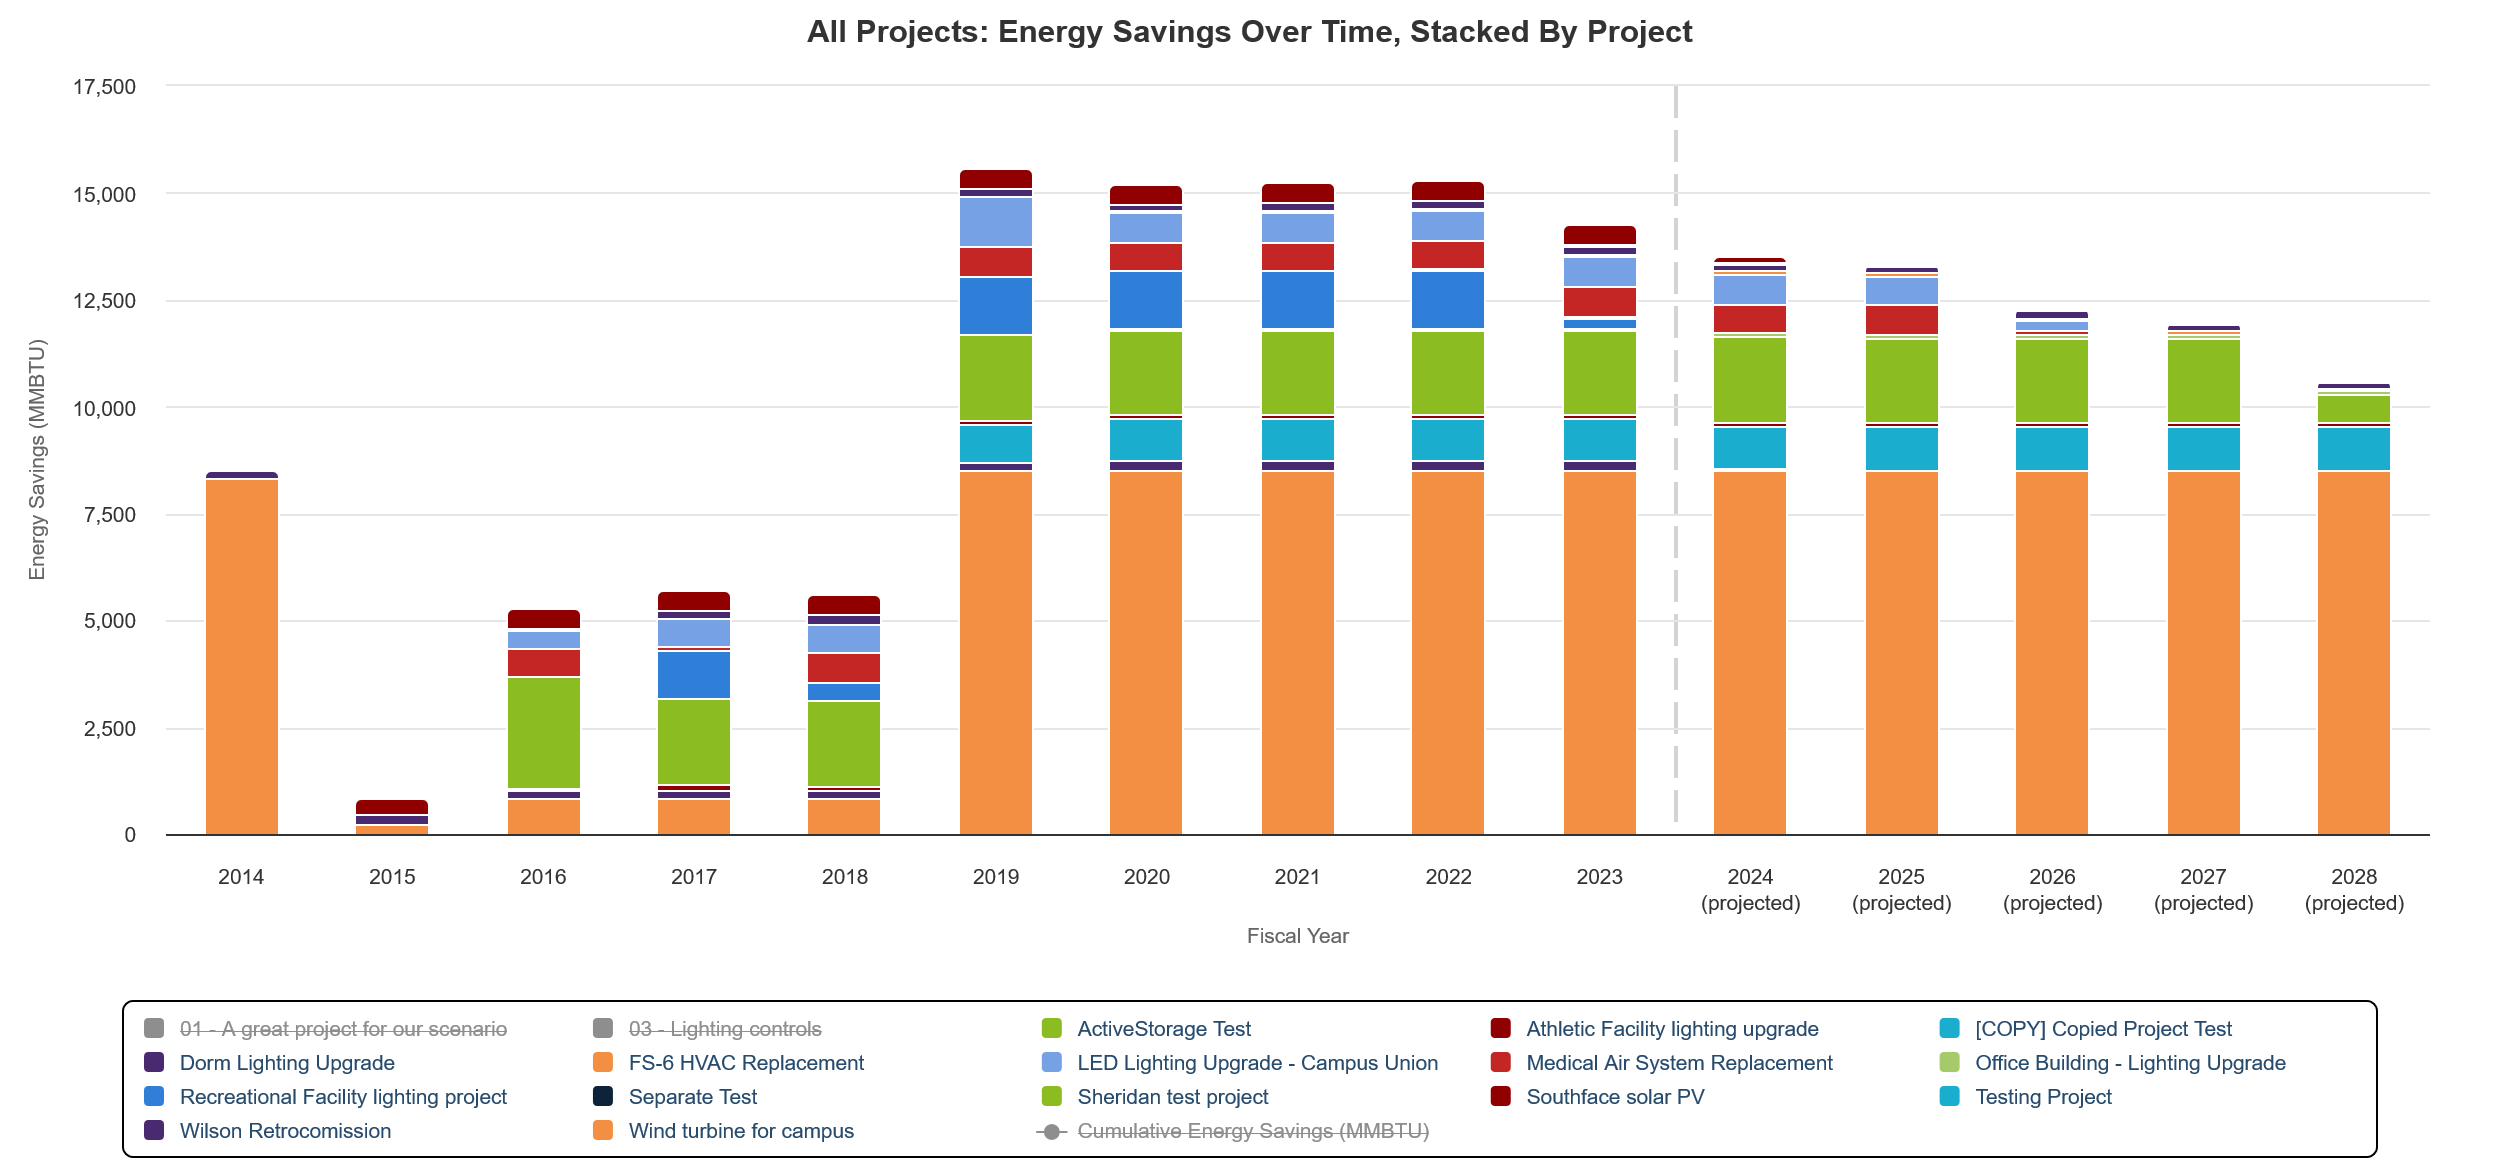
Some project impacts are better understood through charts and graphs than numbers alone. That's where the Reports tab in GRITS comes in.
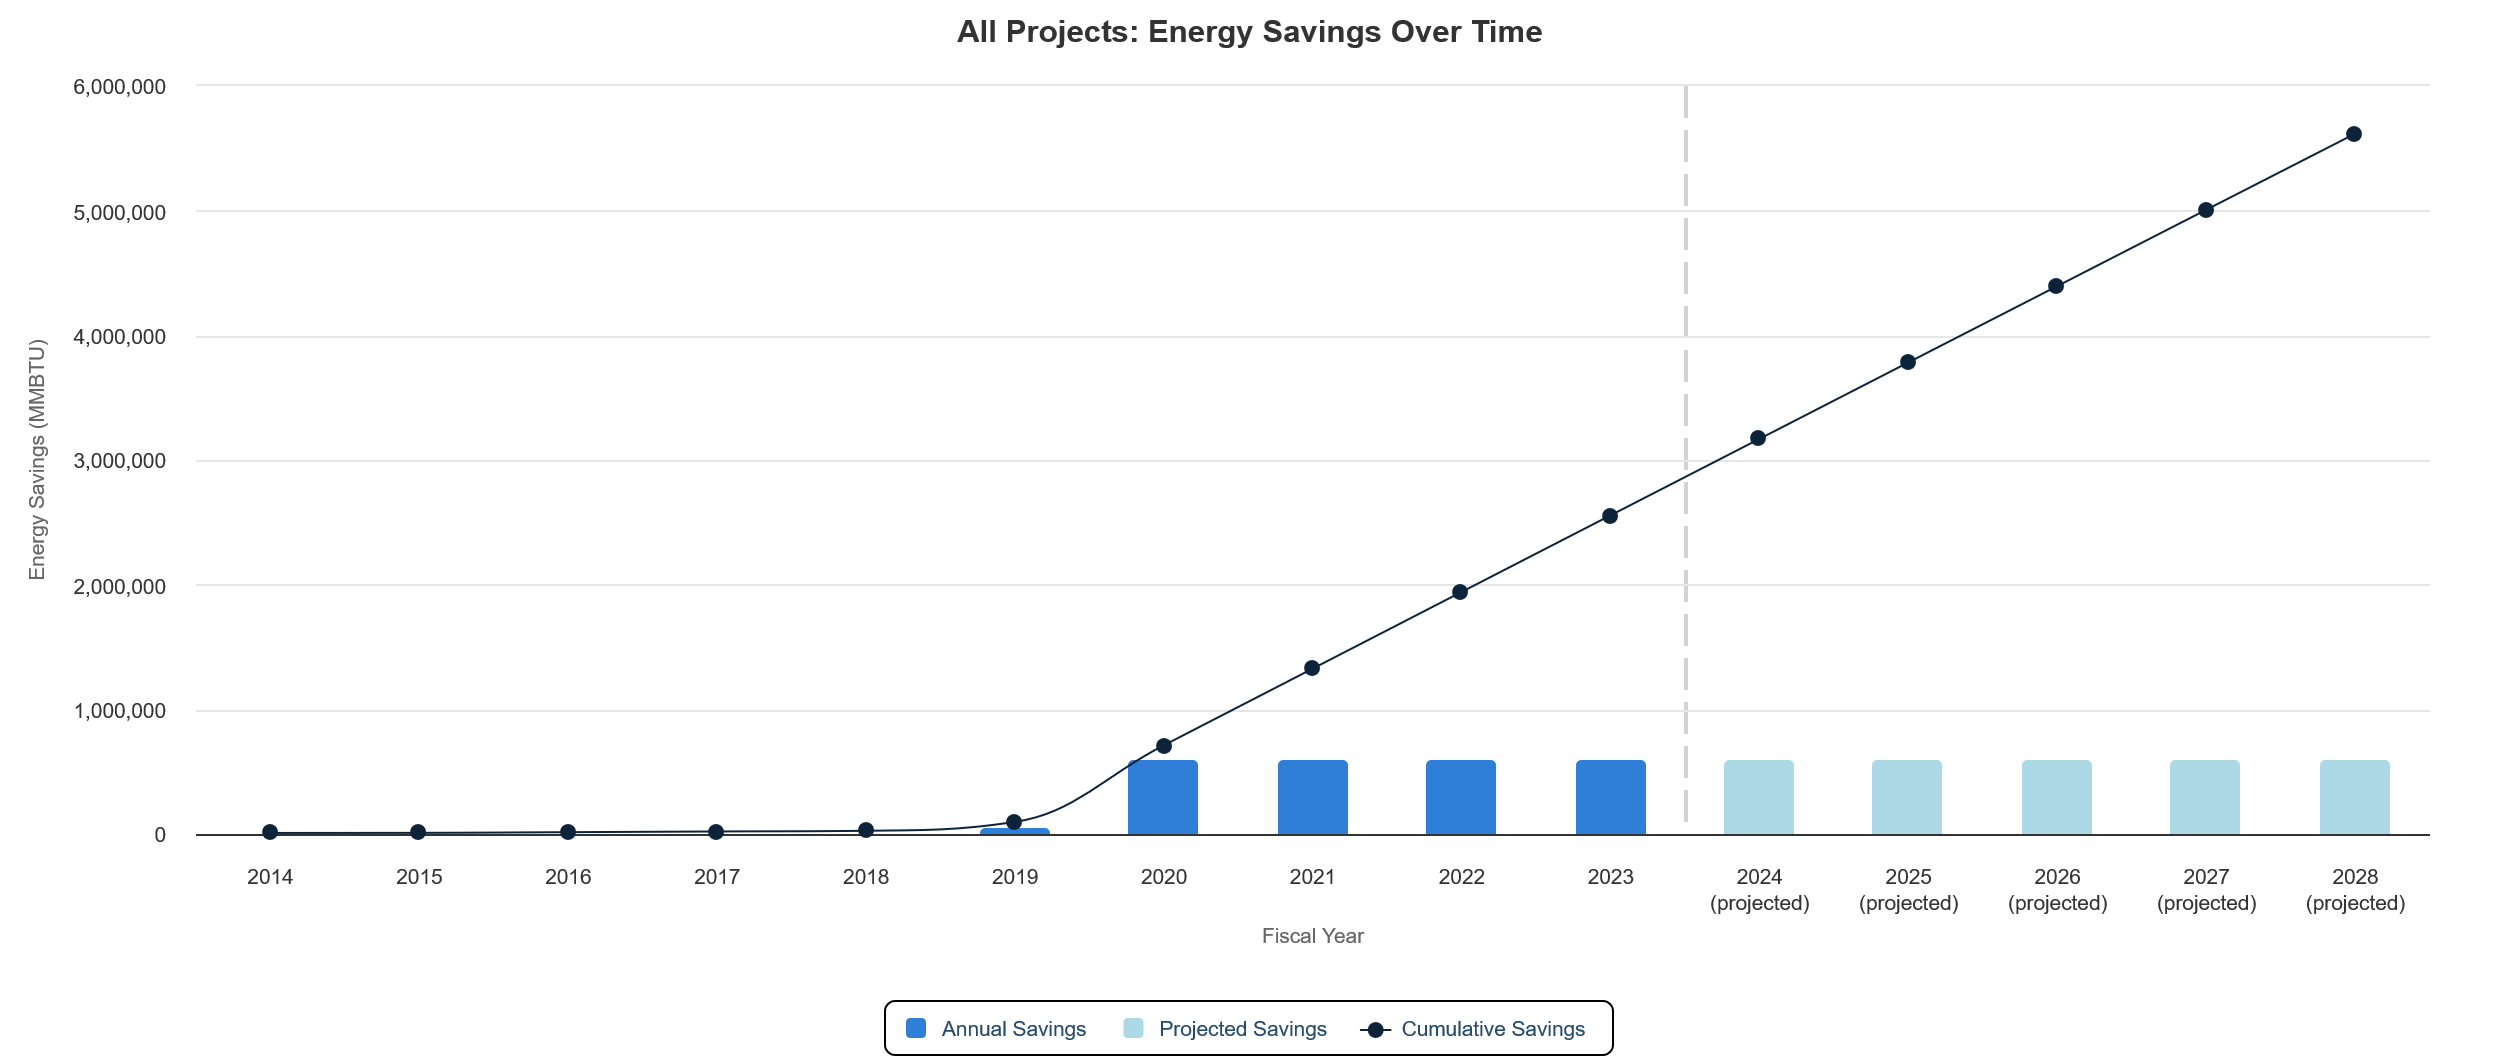
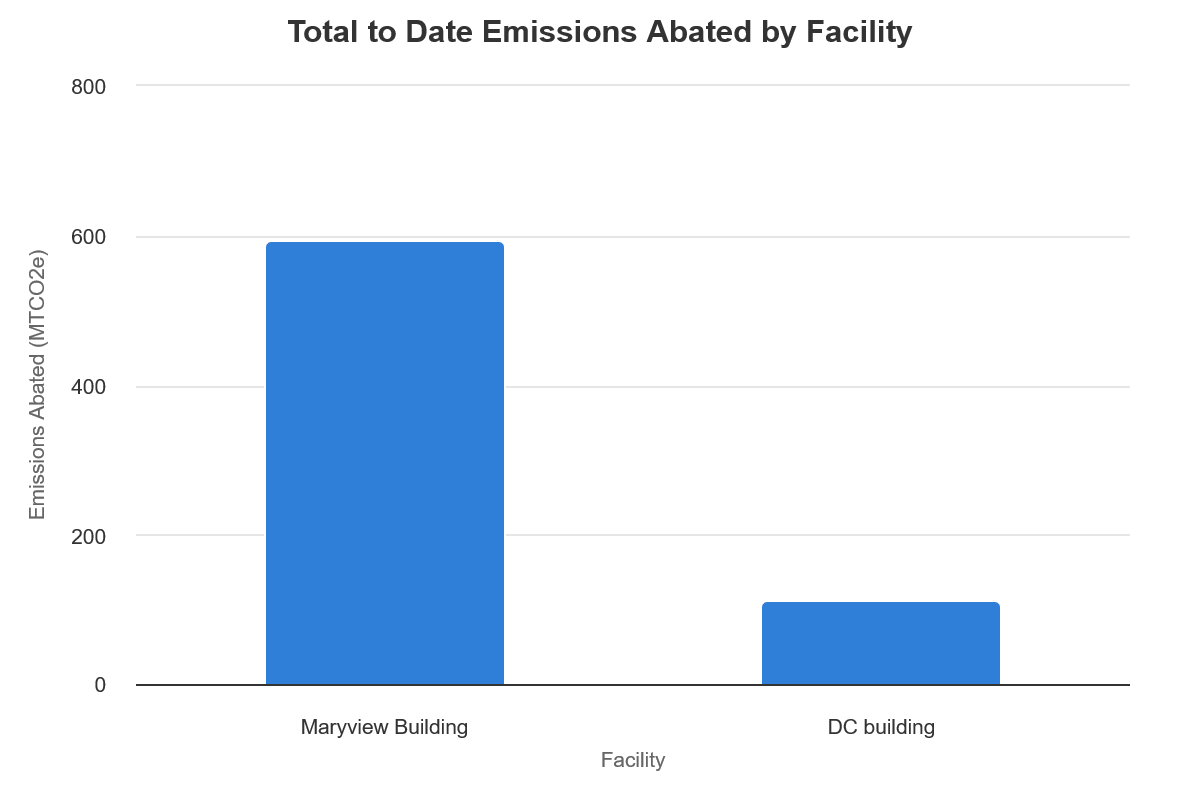 Chart the financial, energy, emissions, water, and waste savings of your projects in seconds. View the impacts of single projects or of all your completed projects.
See your savings over time broken down according to the buildings where your projects took place, the campus/site where they took place, the custom filters ("tags") you've created, or by project type.
You can also use those same categories (by facility, by campus/site, by tag, or by project type) to generate charts showing savings to date.
The benefits of understanding your project impacts
- Push for greater investment in sustainability projects with a business case analysis that financial decision-makers understand.
- Share the impacts of your institution's projects with decision-makers and/or the public. See all the sharing options GRITS provides!
- More easily report on your institution's efforts to reduce carbon emissions or energy use.
- Strengthen your institution's fundraising appeals by incorporating these impact metrics.
- Gain the context you need to evaluate project proposals from contractors.
- Justify the important benefits that project planners and installers (facilities staff, energy managers, etc.) bring to your institution.