For those whose job involves planning or installing projects that reduce resource consumption or carbon emissions, spreadsheets are a commonly used tool for organizing the data involved. They’re certainly better than written notes or documents, or not tracking project-related data at all. But they pose a number of challenges that can drain your time (and patience). Using GRITS to track your project data and your resource use reduction targets helps you leave spreadsheets behind.
___
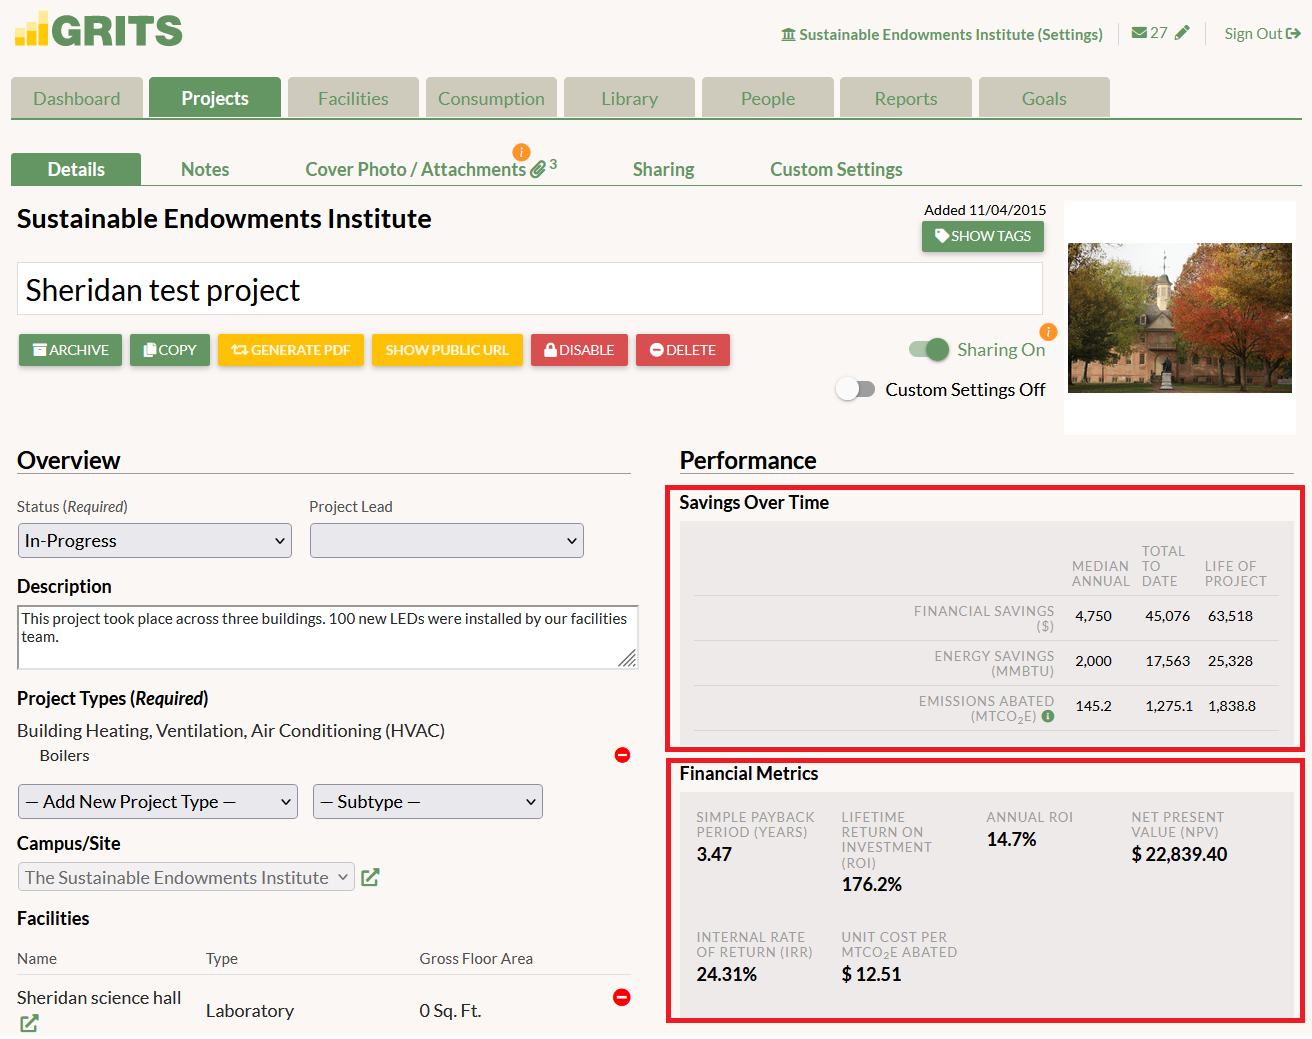
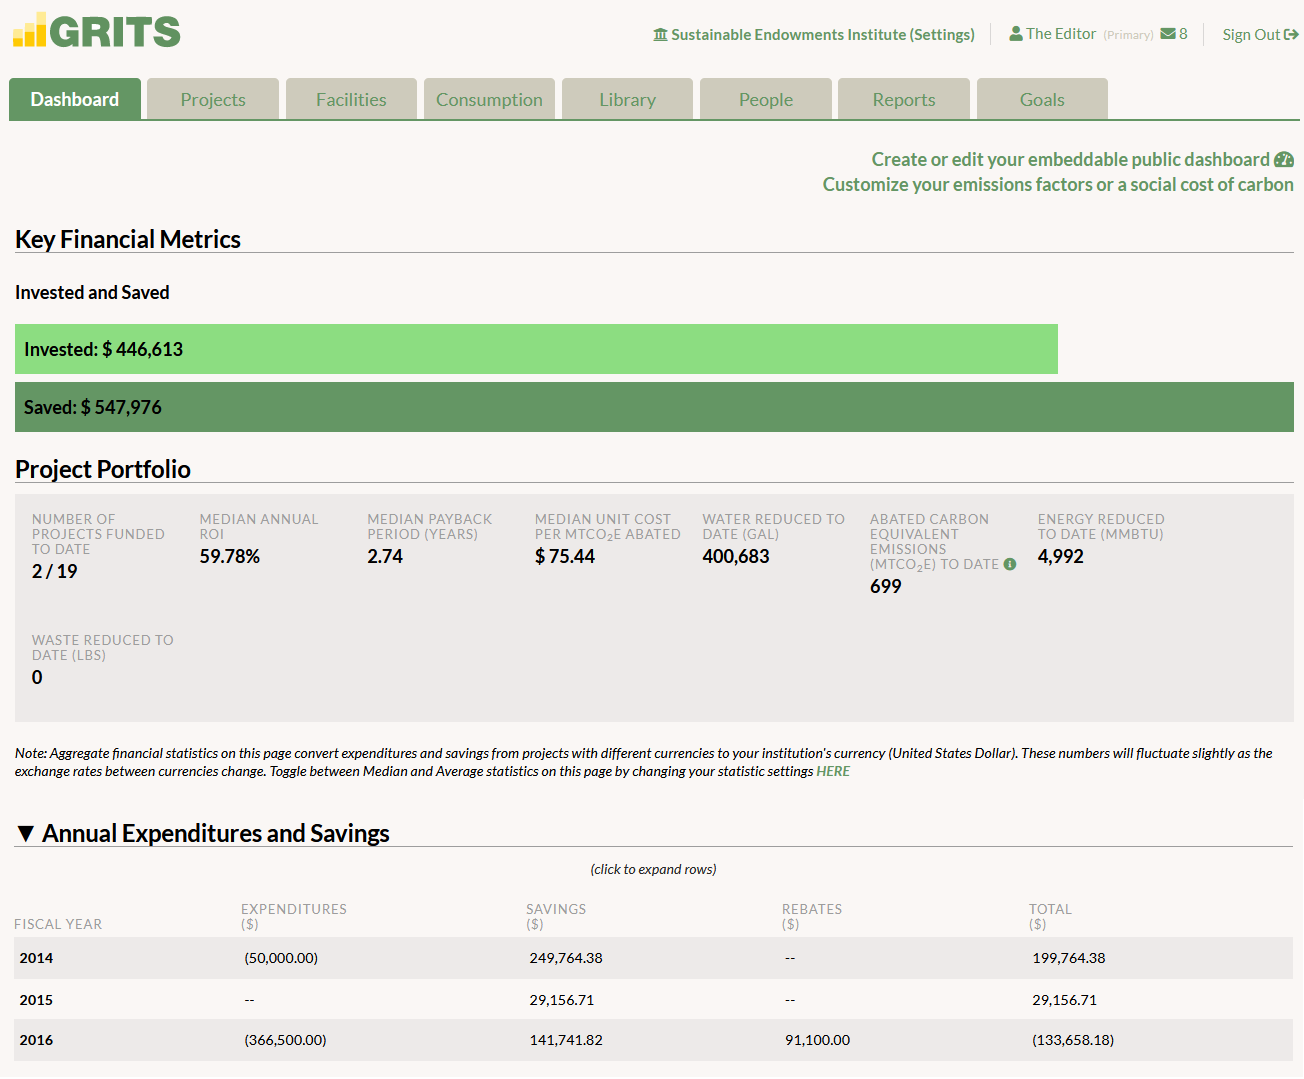
Project-level and portfolio-wide impact metrics calculated with minimal data entry
Spreadsheets: Initially setting up a spreadsheet to calculate project impacts takes a lot of work. Just informing oneself about meaningful metrics to track takes time. More time is needed if additional datasets are required to perform a calculation, like finding emissions factors in order to determine the carbon savings from your energy efficiency projects. And learning how to set up special equations in the formats required by the spreadsheet can feel like learning a foreign language.
GRITS: Numerous meaningful project impact metrics are built into the platform and calculated from a handful of details about each project. Easily track the energy, financial, and carbon savings of individual projects and your whole portfolio. Learn more about the metrics GRITS calculates for you!
Easy-to-use interface & numerous forms of live and self-guided user support
Spreadsheets: Once a spreadsheet is set up, it may not be intuitive to others. Teaching colleagues how to use it can take significant time.
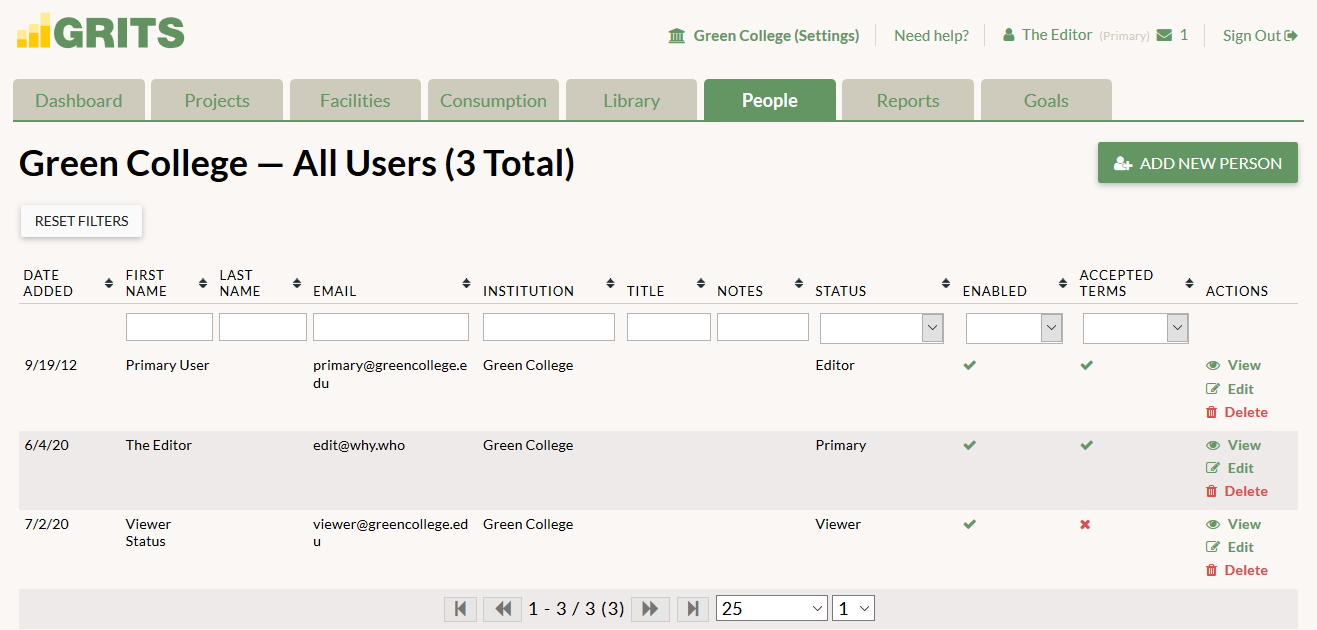
GRITS: GRITS’s intuitive and standardized interface facilitates collaboration between different departments (even those not well-versed in facilities work). Access to your online account can be provided to an unlimited number of people.
Numerous support options make it easy to get started with GRITS, including direct calls and emails with support staff, a live chat feature in the platform, numerous self-paced in-app tours, recorded walkthroughs, and a comprehensive GRITS Guide. A live GRITS walkthrough takes an hour or less, and a project can be created in a couple minutes.
Protection against corrupted files, with editor or read-only access levels for each user & a central location for all of your project data
Spreadsheets: Keeping track of hundreds of projects across dozens of buildings isn’t always easy. If different spreadsheets are used to capture different kinds of data, compiling everything can be time-consuming. The potential for data entry mistakes only increases with the number of projects and spreadsheet collaborators. The worst-case scenario is when a file that hasn’t been backed up becomes corrupted and unusable after lots of effort has been put into it.
GRITS: Tracking project data with GRITS eliminates the risk of corrupted files and can reduce data mistakes. Each password-protected user log-in can be specified with either editor or viewer (read-only) access, so that only those who should be able to add and edit project data are able to do so.
With GRITS, all of your project data lives in one central location. This includes a cash flow table that aggregates each project-level expenditure or rebate you enter, which becomes extra useful if your institution finances projects through a green revolving fund. You can upload all documentation relevant to each project, including requests for proposals, signed contracts, project blueprints, and before and after photos.
Several data sharing features to communicate the impacts of your projects and comply with reporting requirements
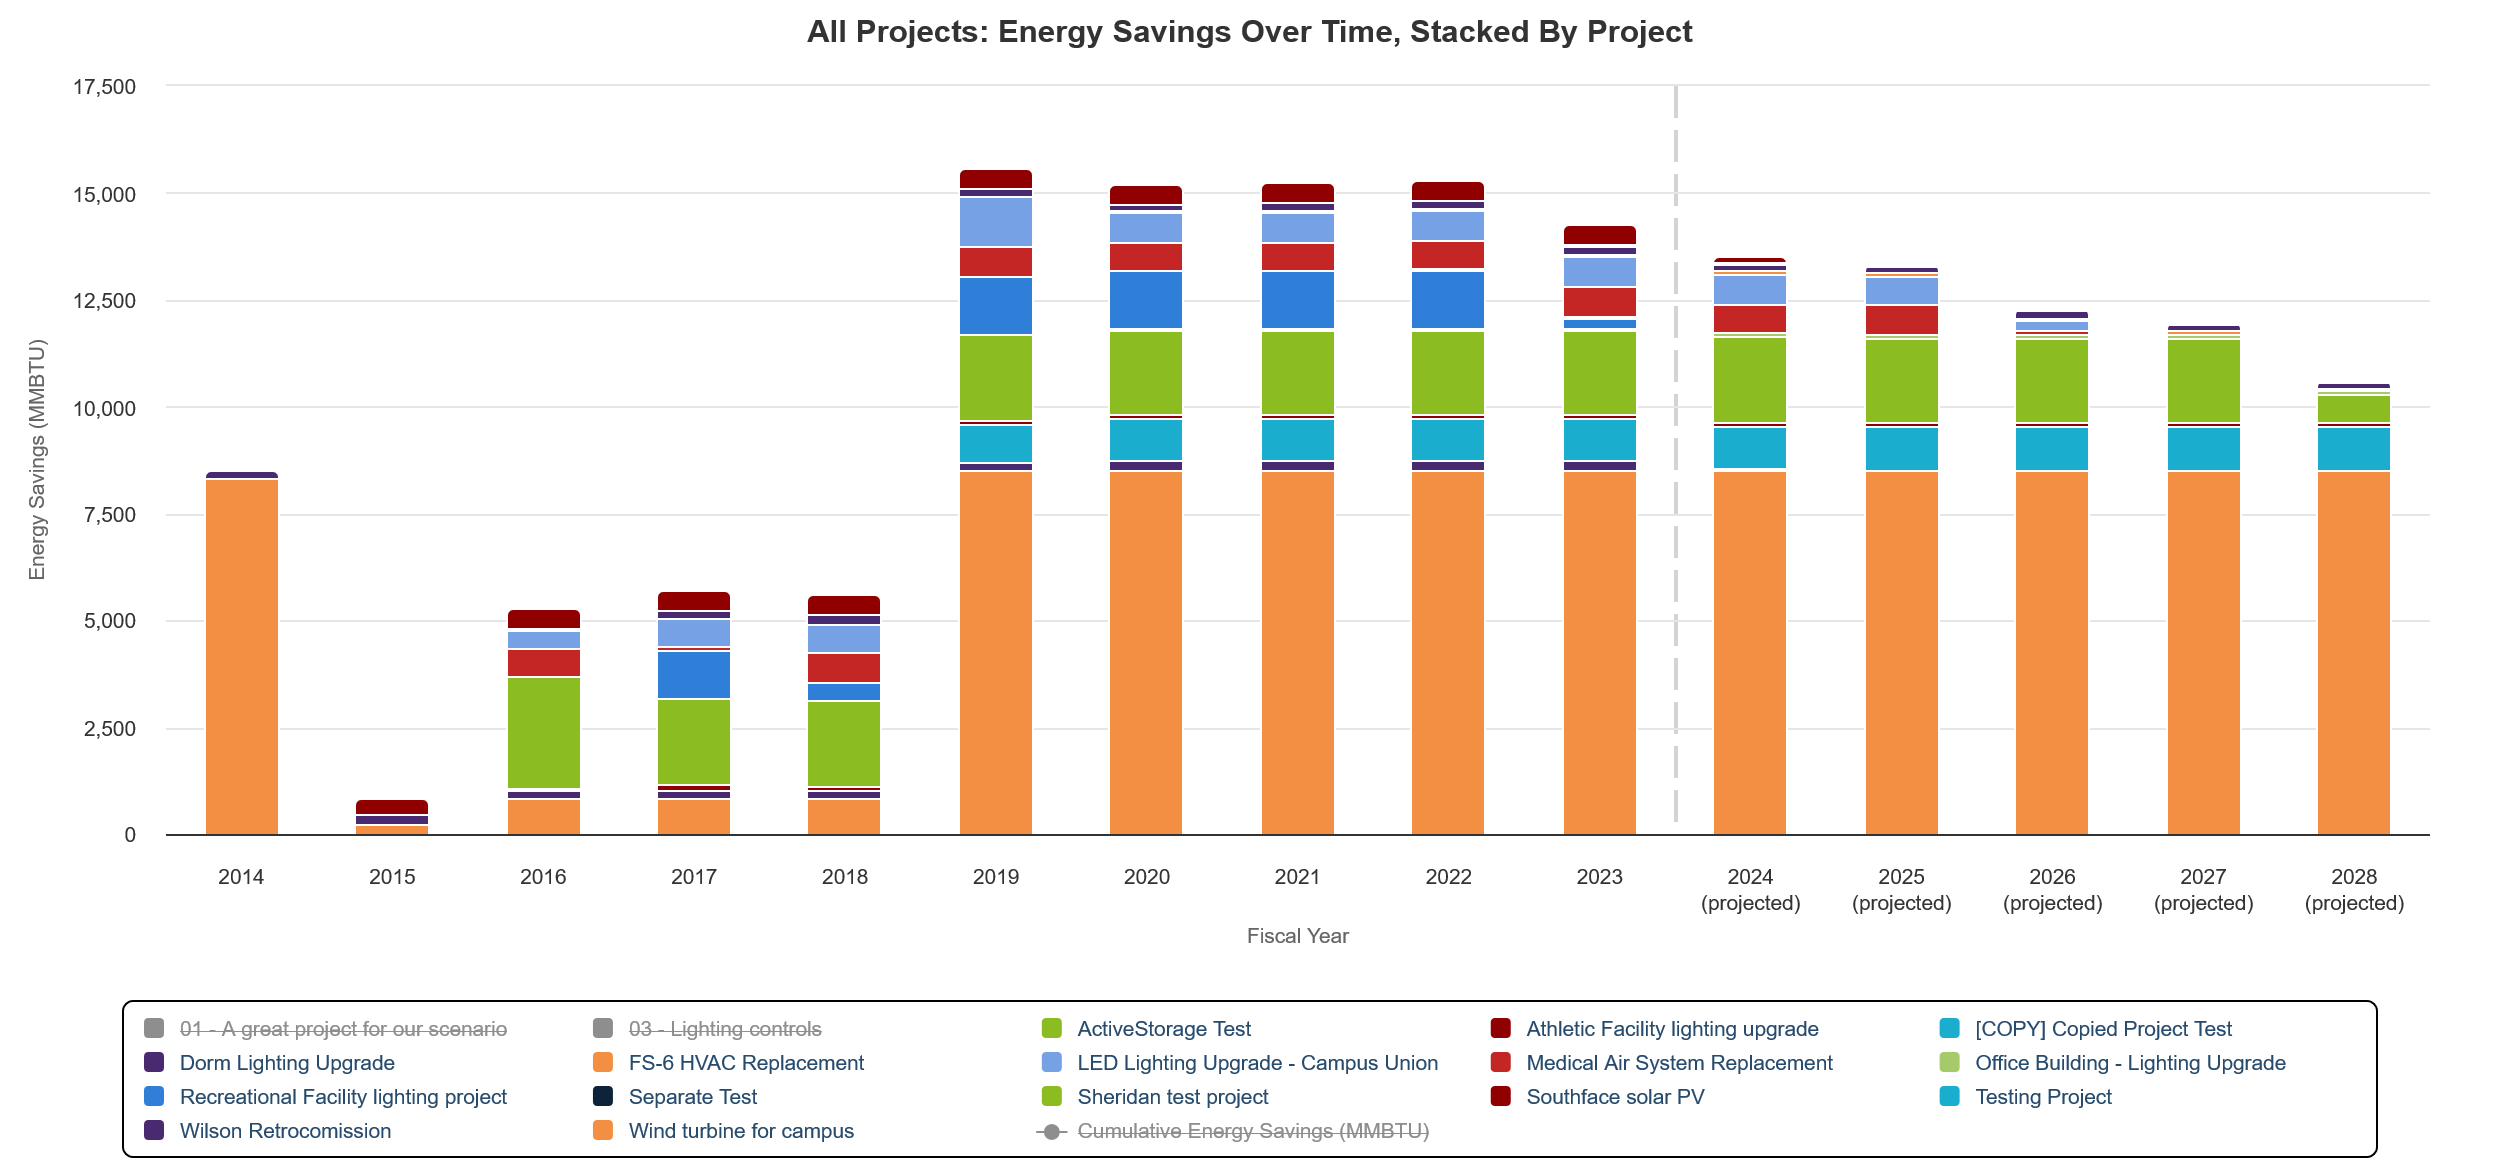
Spreadsheets: Sharing the insights contained in a spreadsheet with decision-makers who aren’t familiar with it requires its own learning curve. Even after data has been collected and project impact metrics are getting calculated, you still need to figure out how to build charts and other visuals from your data. Spreadsheets don’t allow for dynamic or interactive charts, limiting the options you have to illustrate your work.
GRITS: GRITS has several sharing features that make it easy to communicate the impacts of your projects with others and facilitate compliance with reporting requirements. Generate charts of your project impacts or embed interactive dashboards into your institution’s websites. See all the sharing options GRITS provides!
Easier staff transitions
Spreadsheets: When all of your institution’s project data lives in a spreadsheet, staff transitions can get messy. Departing staff need to set aside time to teach new hires about how the sheet works. If that knowledge transfer doesn’t happen, it can sideline an institution’s ability to keep track of its projects.
GRITS: GRITS eases staff transitions with its intuitive interface, short learning curve, and support professionals available to provide training and assist new users with any questions they have.
 ___
___
GRITS has many advantages over spreadsheets. It’s likely to save you and your team a lot of time and frustration. It offers even more advantages if your institution hasn’t been keeping track of its project data at all. By entering this data into GRITS you’ll get a better understanding of your projects’ impacts, which can help justify the important benefits that project planners and installers (facilities staff, energy managers, etc.) bring to your institution.
To recap the main points, GRITS offers:
- Project-level and portfolio-wide impact metrics calculated with minimal data entry. See which metrics GRITS calculates for you!
- An intuitive and standardized interface.
- Numerous forms of live and self-guided user support.
-
Protection against corrupted files and data mistakes, with editor or read-only access levels for each user.
-
A central location for all of your project data, including all relevant documentation.
- Several data sharing features to communicate the impacts of your projects and comply with reporting requirements. See all the sharing options GRITS provides!
- Easier staff transitions.