One of the major ways GRITS can support your work is by helping you understand the energy, financial, and carbon savings of your sustainability projects. Perhaps your institution has never consistently tracked the impacts of your projects. Or maybe you’re keeping track of some project details in a spreadsheet, but lacking many of the metrics you’d like to know. That’s where GRITS can make a big difference.
The platform generates and presents three kinds of impact data: project-level, portfolio-wide, and illustrated reports.
Project-level
Each project you enter has its own impact calculations–check it out.
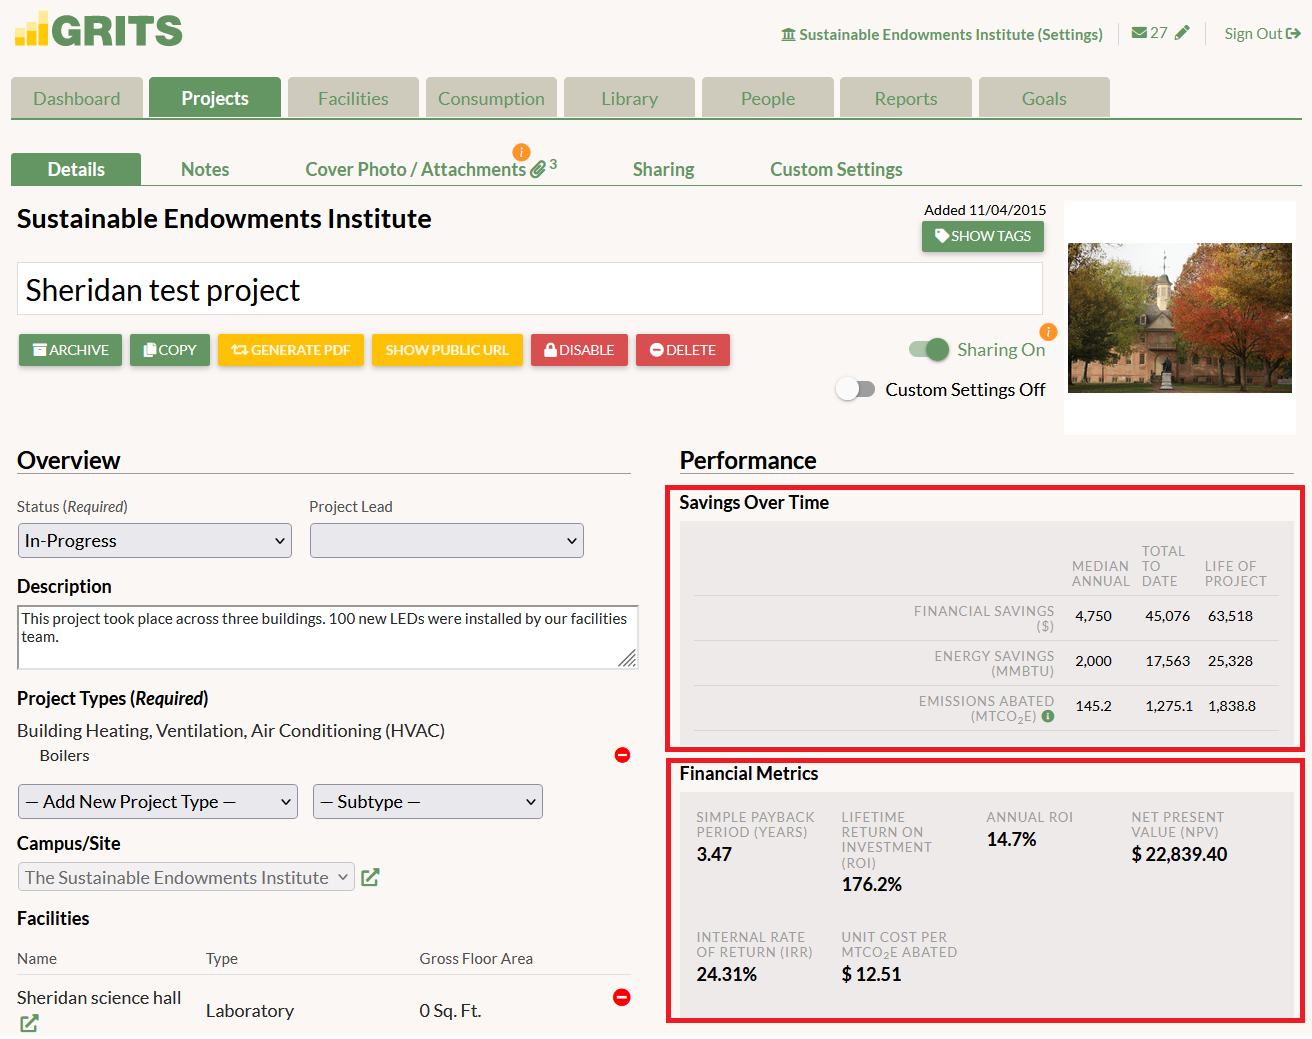
GRITS calculates each project’s financial, energy, carbon emissions, water, and waste savings, breaking them out into three categories: median annual savings, total to date savings, and lifetime savings (over the course of the new equipment’s lifespan).
GRITS also calculates a number of financial metrics that allow you to evaluate the project’s effectiveness as an investment. These include the payback period, annual and lifetime return on investment (ROI), net present value (NPV), internal rate of return (IRR), and unit cost per MTCO2e abated.
And to get all of these calculations, you only need to enter a handful of data points for a project (or use our spreadsheet upload option to add multiple projects at the same time).
You can also easily customize these calculations in several ways:
- You’re able to update the price of a saved resource or the actual amount saved (e.g. if utility meters are in place) in any fiscal year, and when you do, all of these calculations update automatically.
- Does your institution use different electricity emissions factors than others in your area? GRITS lets you customize your emissions factors for electricity and a number of other resources to ensure your carbon emissions savings calculations are accurate.
- Does your institution apply a social cost of carbon (SCC) or carbon price to your emissions? If so, you can enter your SCC framework into GRITS and have the platform calculate the “carbon reduction impact” (i.e. the avoided damages in dollar terms resulting from reduced emissions) for each project. You can even formally incorporate the carbon reduction impact into your projects’ financial savings.
- GRITS also allows you to apply resource price forecasts to your projects to see how your financial savings would increase if utility prices rise.
Portfolio-wide
GRITS aggregates your project data, allowing you to evaluate your entire portfolio or just a specific piece of it. Most of these metrics match those calculated for each individual project (e.g. median annual/to-date/lifetime savings across avoided costs/energy/emissions/water/
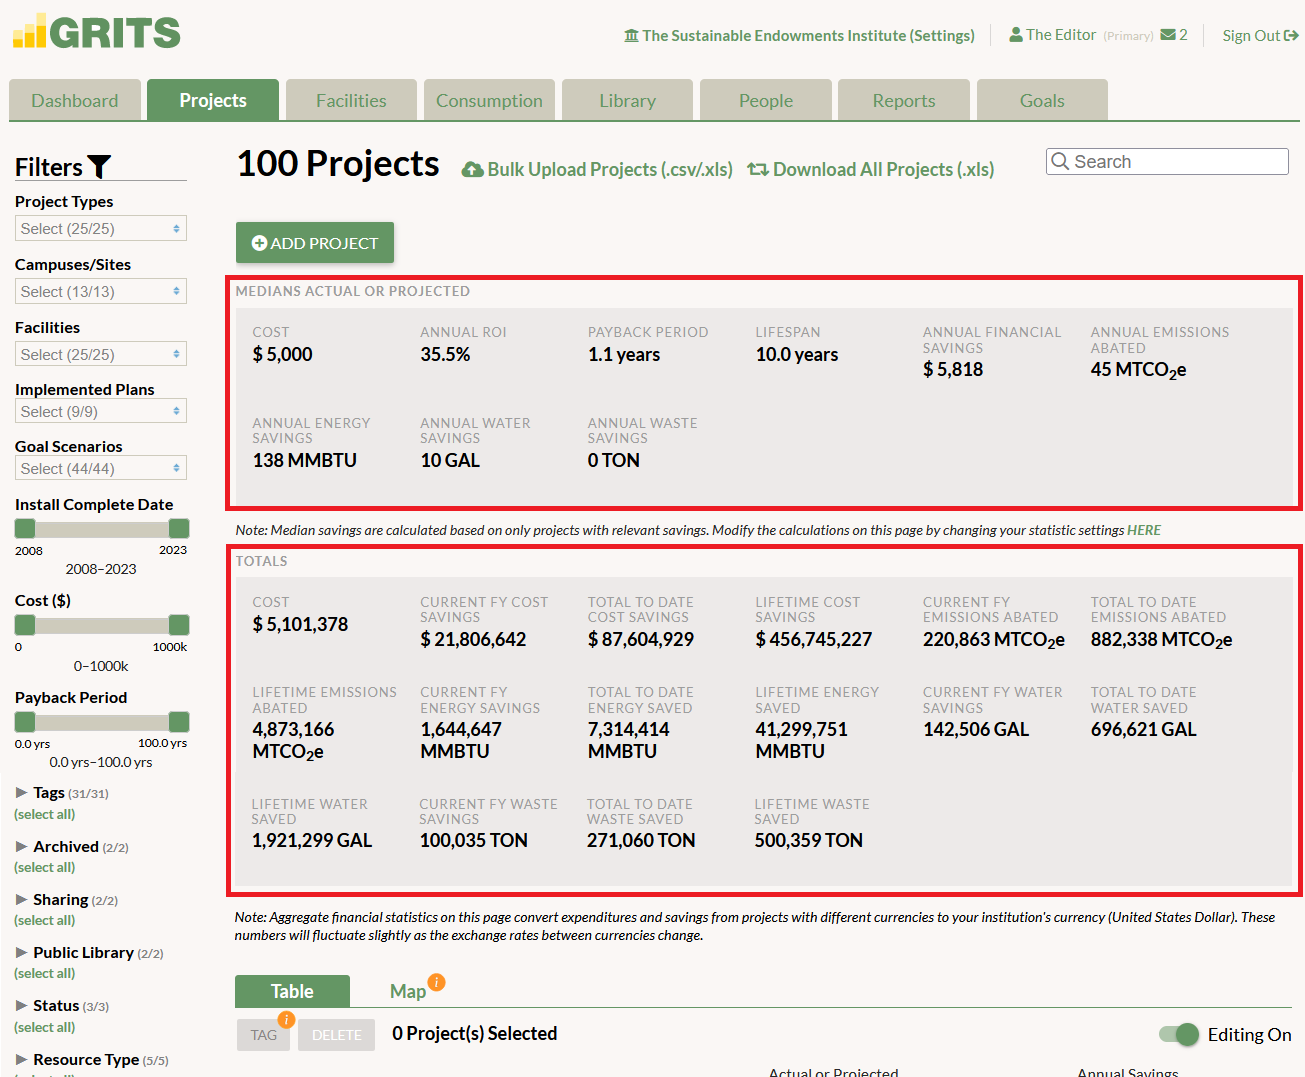
You can dive further into your data through numerous filters. Only want to see the impacts of your completed projects? Or perhaps you’re currently interested in the anticipated impacts of proposed projects. Filter by project type (e.g. lighting, HVAC, renewable energy, etc.), campus/site, facility, cost, and many more options–even create your own custom filter.
Illustrated reports
Some project impacts are better understood through charts and graphs than numbers alone. That’s where the Reports tab in GRITS comes in.
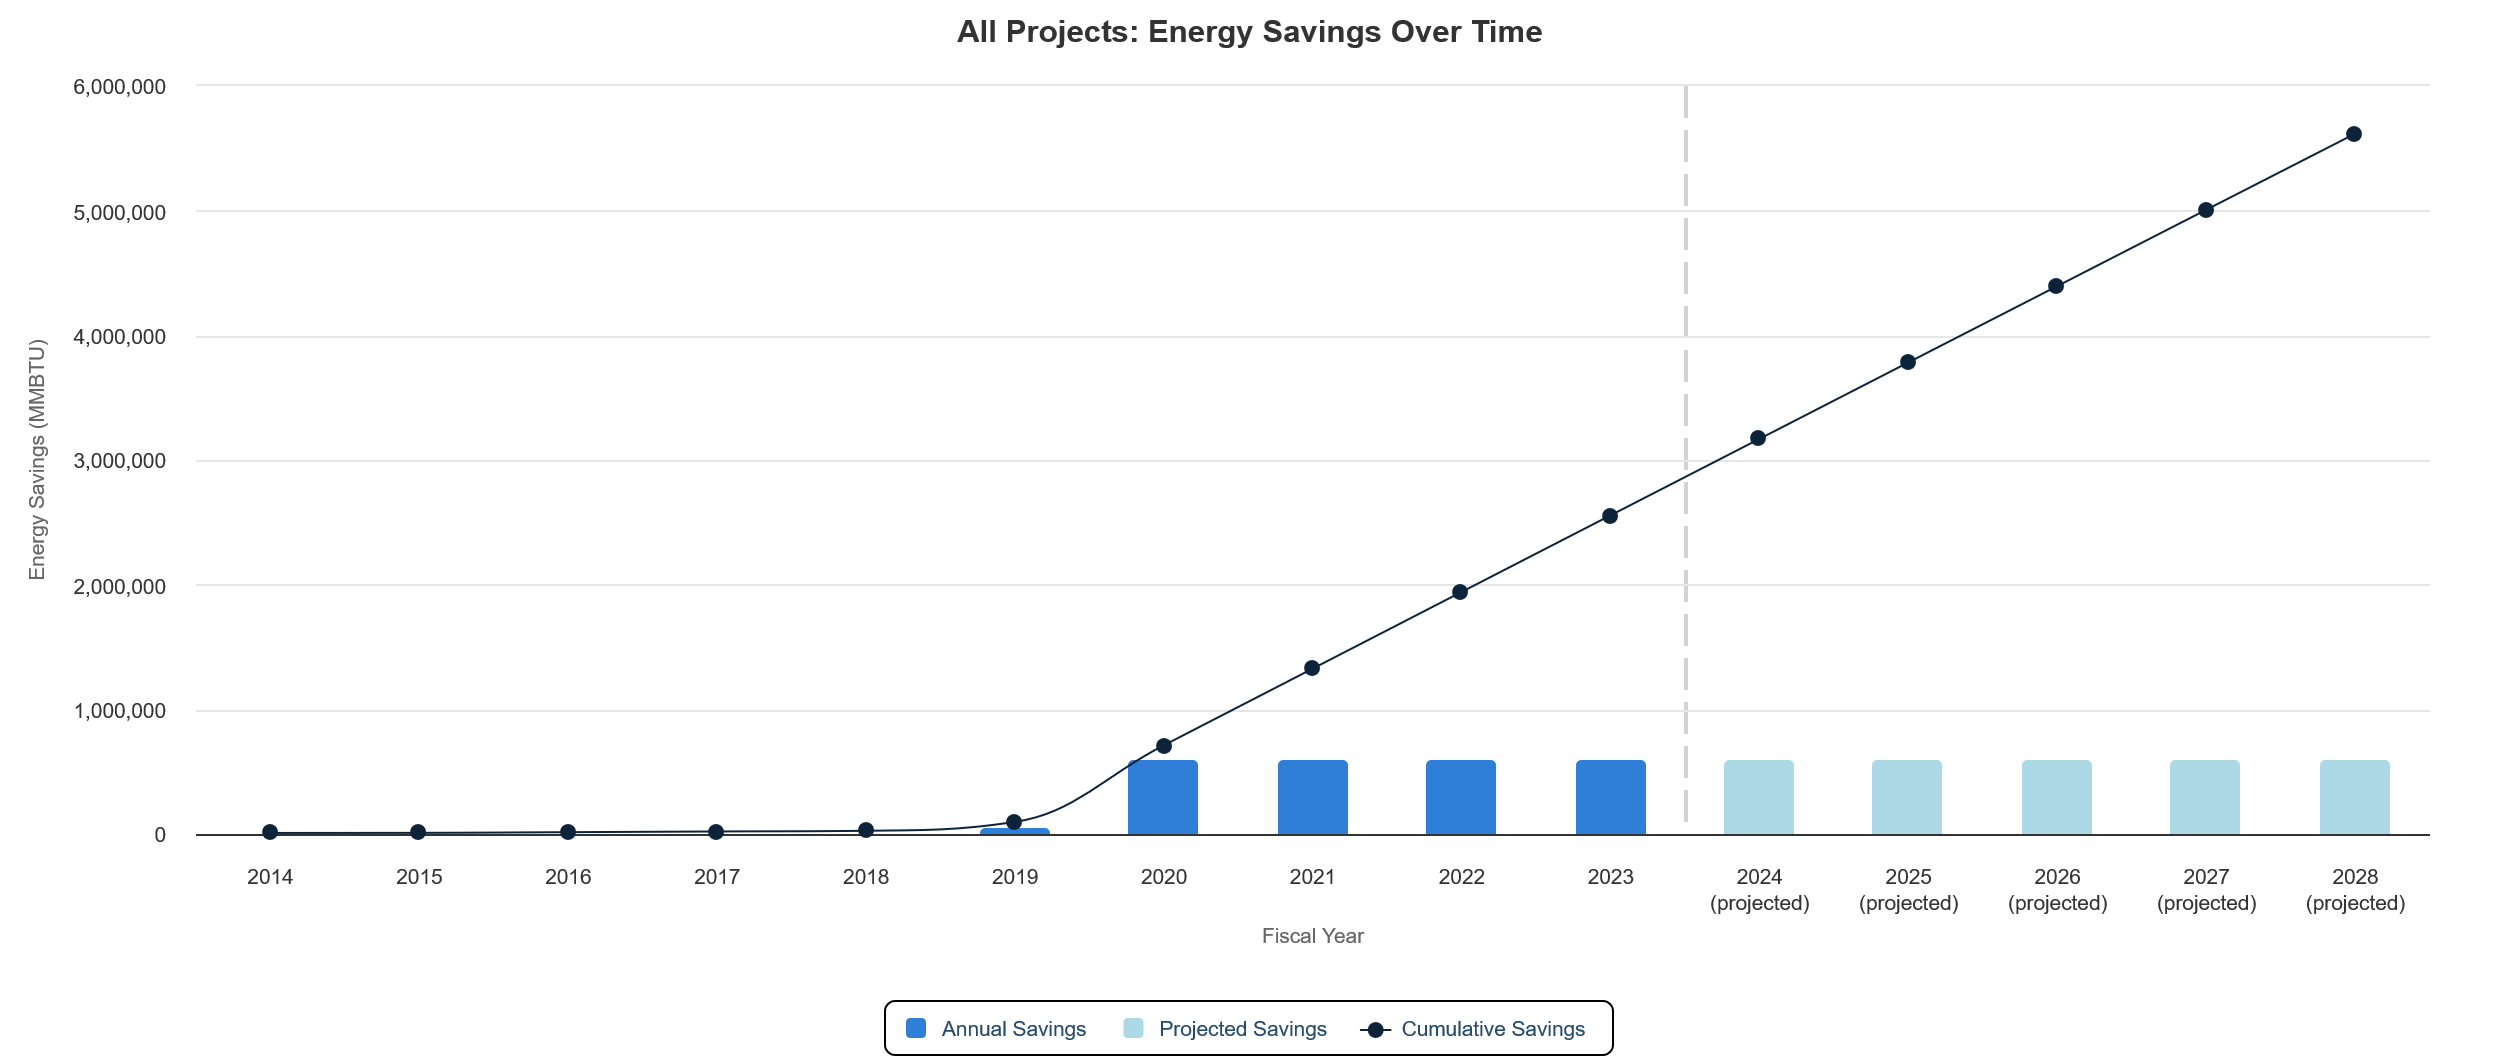
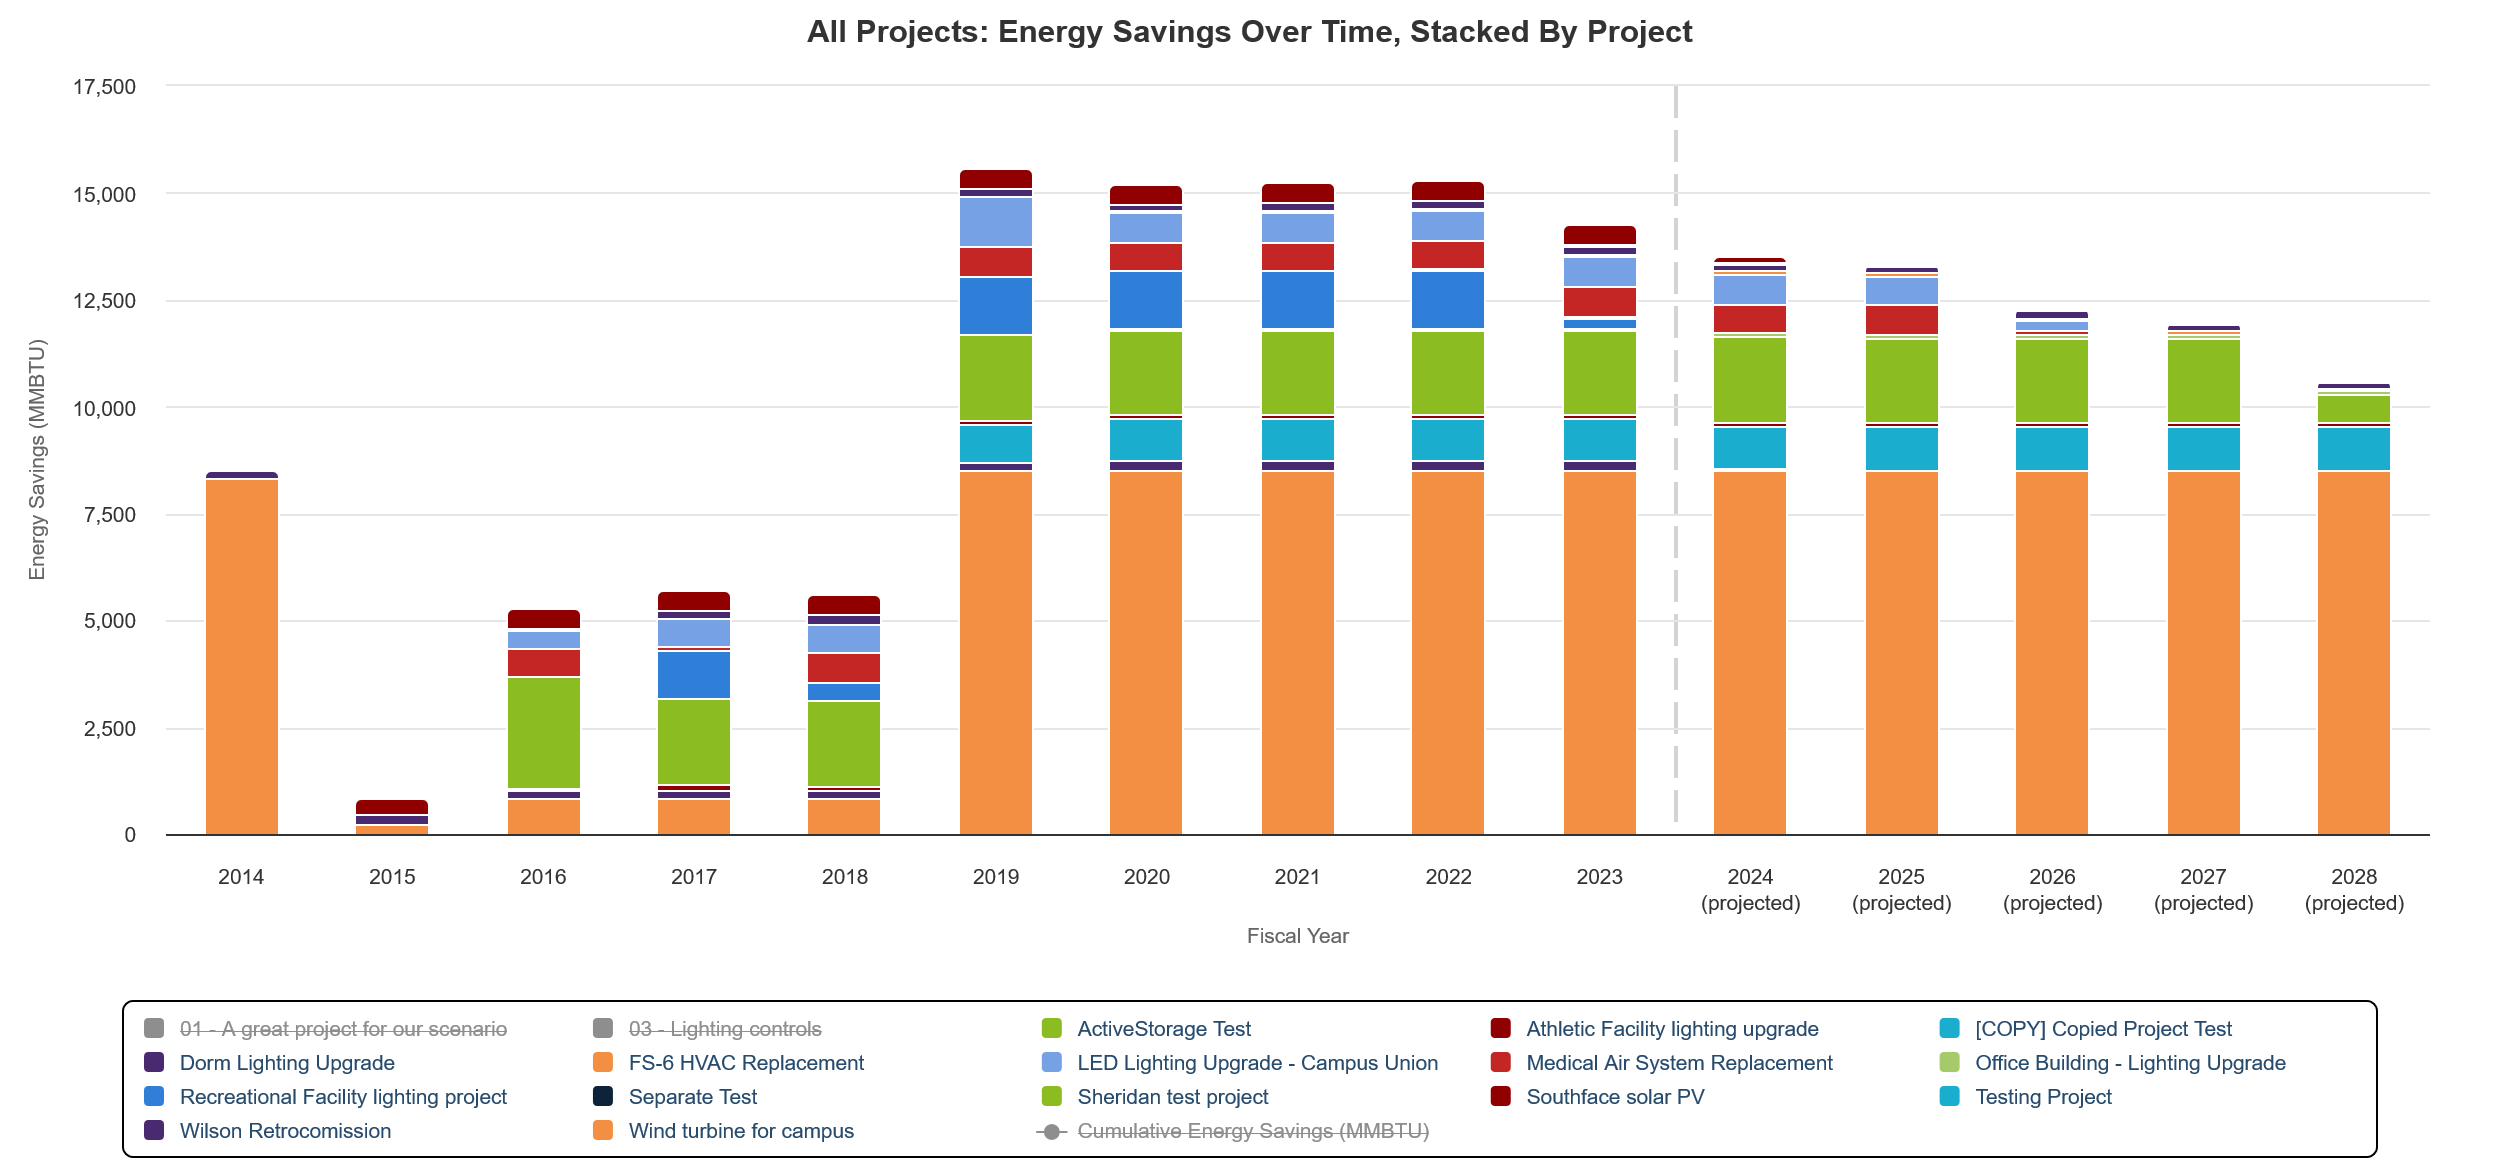
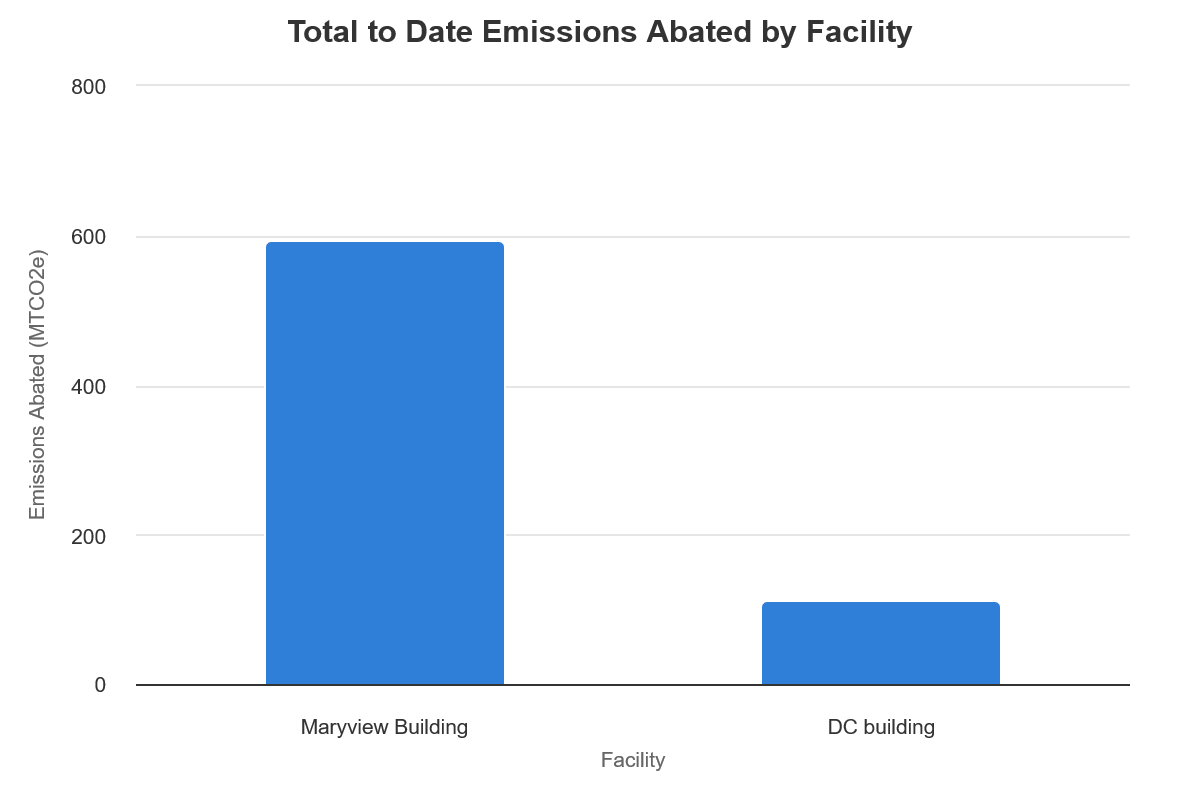 Chart the financial, energy, emissions, water, and waste savings of your projects in seconds. View the impacts of single projects or of all your completed projects.
See your savings over time broken down according to the buildings where your projects took place, the campus/site where they took place, the custom filters (“tags”) you’ve created, or by project type.
You can also use those same categories (by facility, by campus/site, by tag, or by project type) to generate charts showing savings to date.
The benefits of understanding your project impacts
- Push for greater investment in sustainability projects with a business case analysis that financial decision-makers understand.
- Share the impacts of your institution’s projects with decision-makers and/or the public. See all the sharing options GRITS provides!
- More easily report on your institution’s efforts to reduce carbon emissions or energy use.
- Strengthen your institution’s fundraising appeals by incorporating these impact metrics.
- Gain the context you need to evaluate project proposals from contractors.
- Justify the important benefits that project planners and installers (facilities staff, energy managers, etc.) bring to your institution.