GRITS offers numerous features for sharing your project-level, portfolio-wide, and sustainability action plan data. With so many ways the platform can help you communicate the impacts of your work, we thought it could be helpful to put together a list!
Project-level sharing features
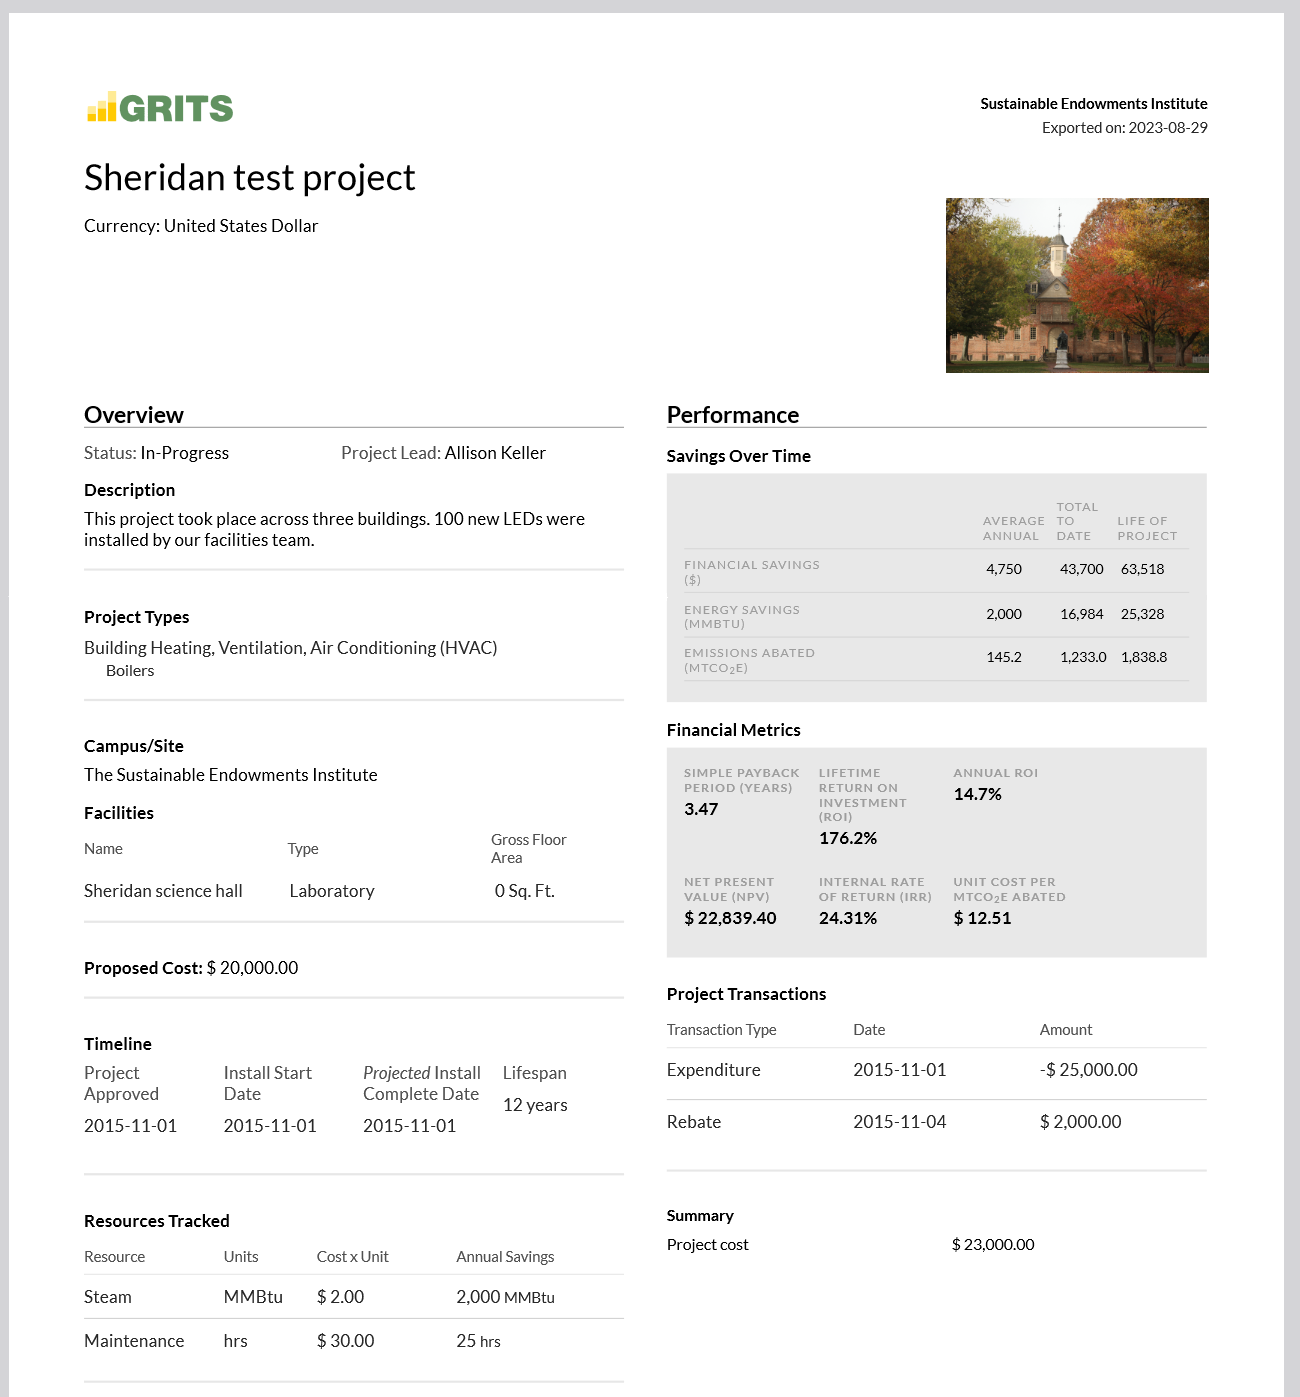
1) Project-level PDFs: Export all of the details associated with each project into an easy-to-read PDF format in one click. Build a report from these PDFs to share with others.
To use this feature, just click the “Generate PDF” button on any of your Project Details pages. In a few seconds, you will be able to download the generated PDF right on that page. You’ll also receive a copy of the PDF sent to your email.
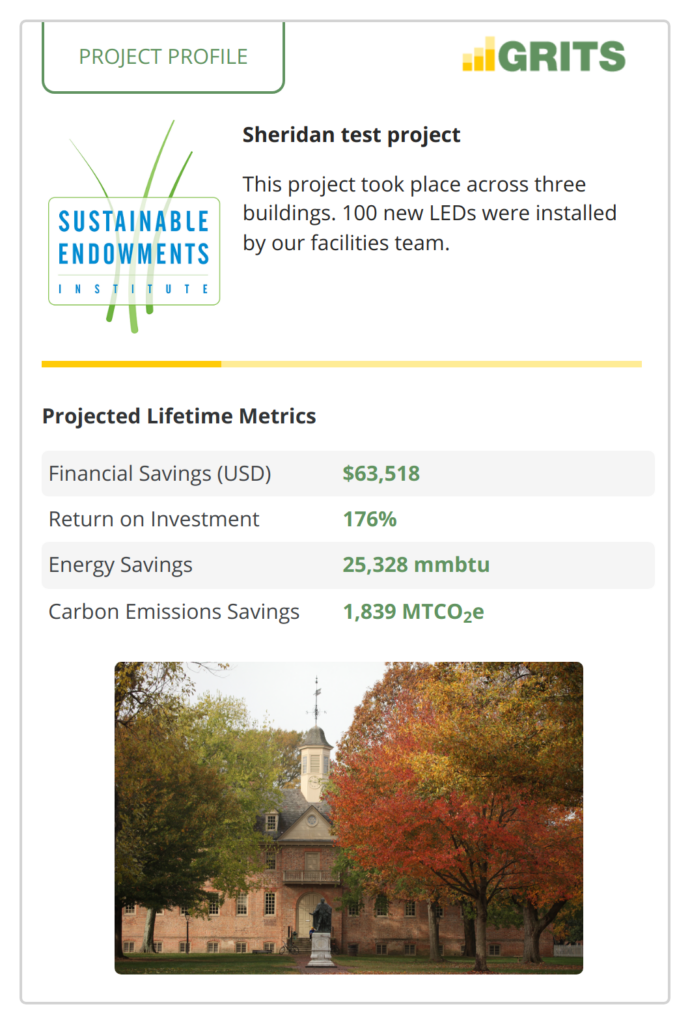
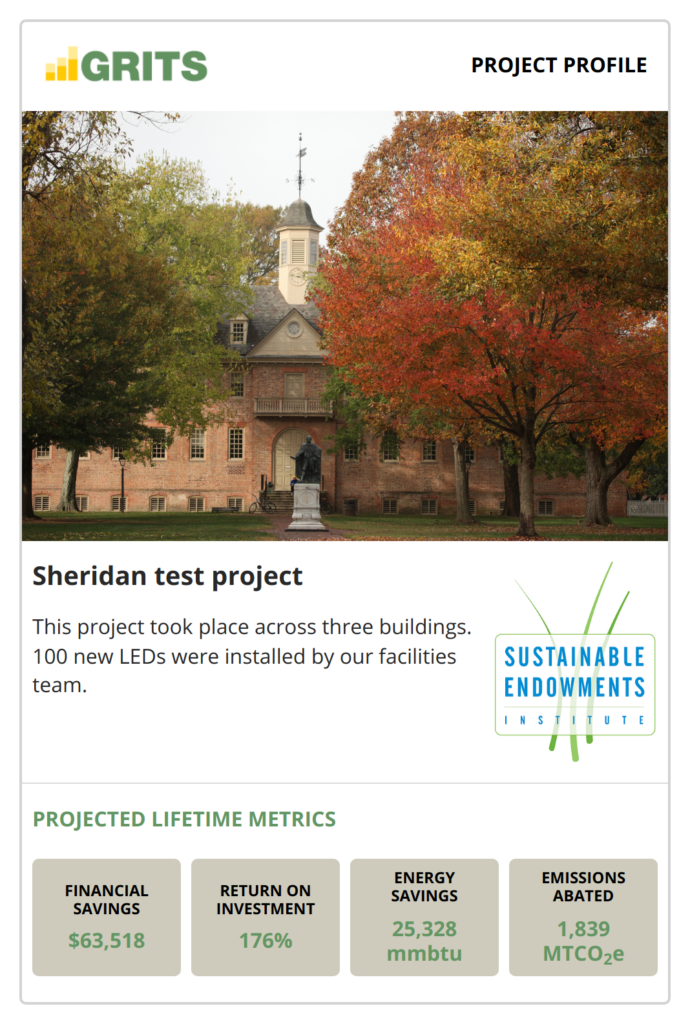
2) Project Profiles: The Profile is a widget that displays your project’s name, description (up to around 120 characters), lifetime energy/carbon/water/waste/financial savings and return on investment, any publicly visible cover photo that you’ve chosen, and your institution’s logo (if available). It’s a great option for publicly highlighting your project’s impact in a more compact format than the project-level webpage. You can either embed this widget in a website (it will update automatically whenever your project data changes) or download these images as PNG files for social media posts.
To use this feature, click on the Sharing sub-tab on any of your Project Details pages. There you’ll find each Project Profile layout option. To make them more engaging, upload your institution’s logo (on the Settings page, which is accessed by clicking on the name of your institution at the top of the screen) and a public cover photo for the project (on the Cover Photo / Attachments sub-tab to the left of the Sharing sub-tab)–these images will appear in your Profiles as in the examples below. Click the “Download as an Image” button below either Project Profile layout to get the PNG version, or copy the embed code and paste it into the backend of a website to display the live version.
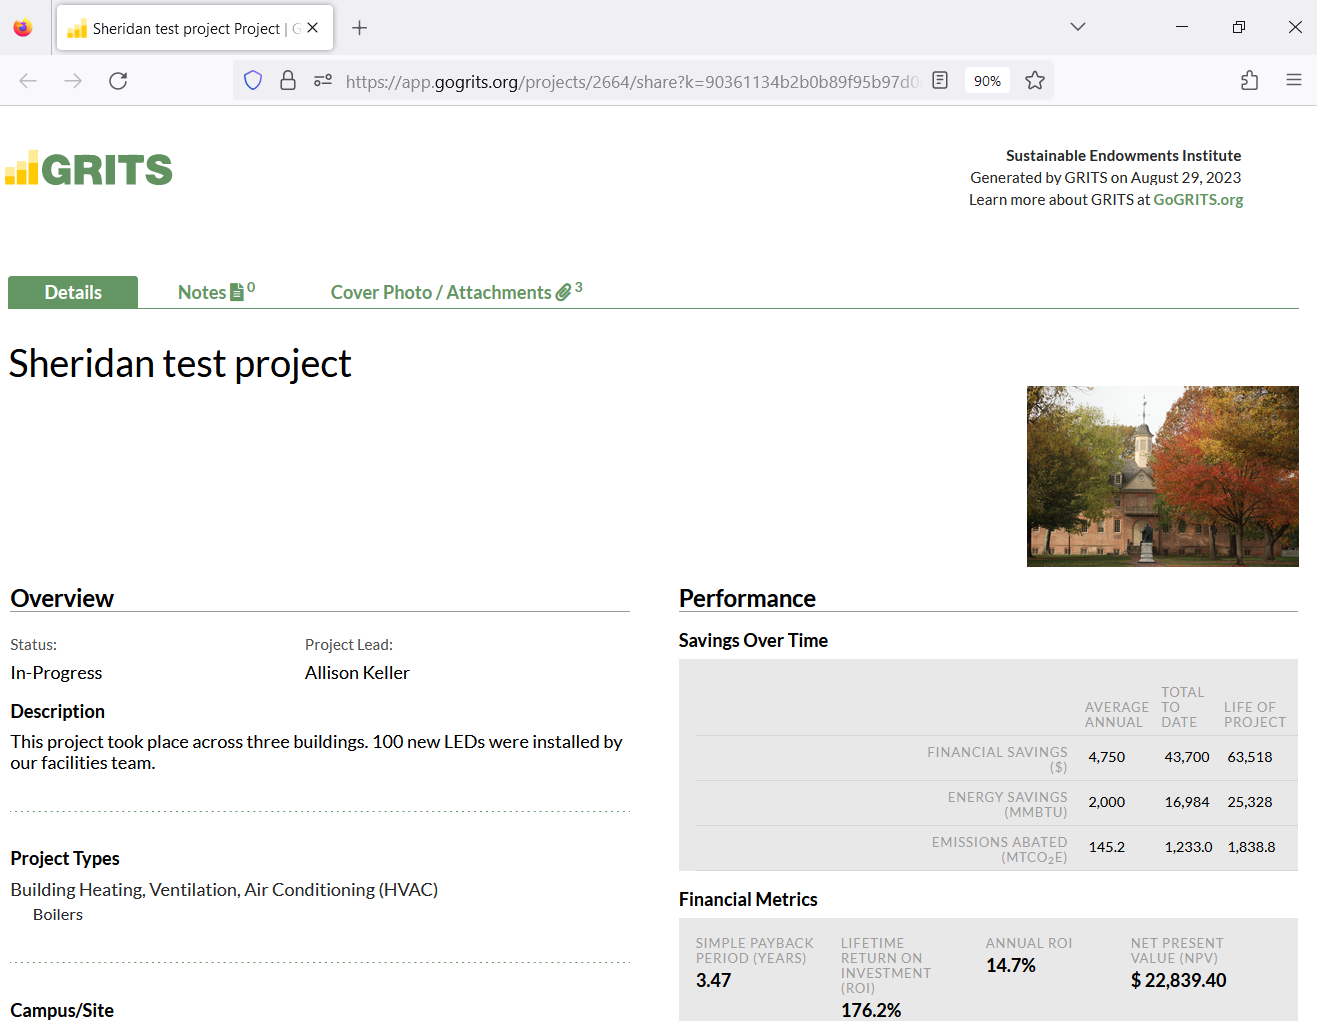
3) Project-level read-only webpages: Looking just like the project-level PDF, this option allows you to share a link to a read-only webpage that displays all of your project’s details. This webpage will update automatically whenever your project data changes and can be viewed by anyone, even if they don’t have access to GRITS. You can easily revoke access later by disabling the link.
To use this feature, flip on the “Sharing” switch which appears on the front of each Project Details page. A new “Show Public URL” button will appear to the left. Click it to reveal the project’s custom shareable link, which you can share with an individual or post on a website.
Portfolio-wide data sharing features
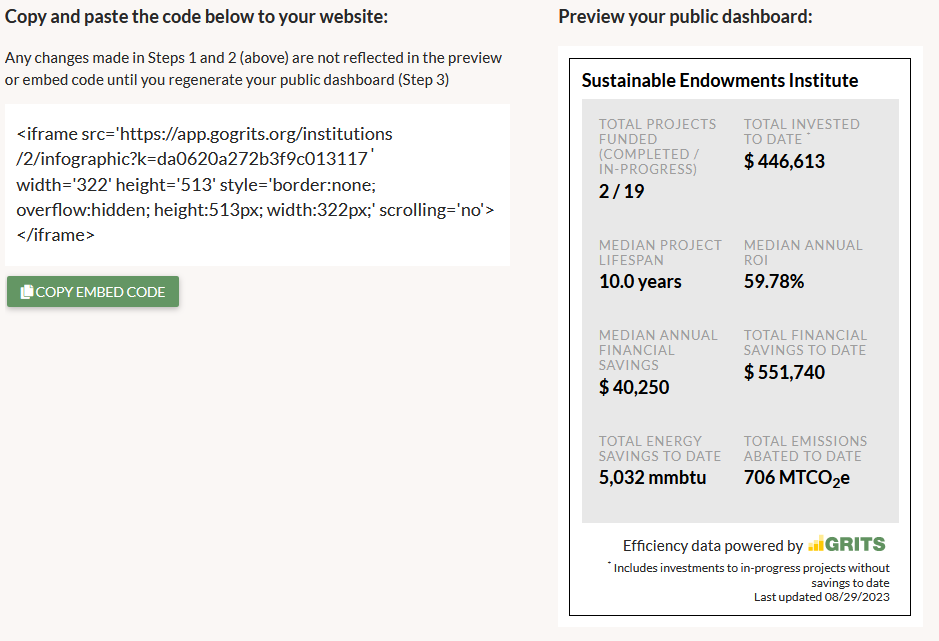
4) Customizable Public Dashboard: Choose between four and eight metrics that aggregate data across your project portfolio and select your preferred layout, and GRITS will generate a Public Dashboard that you can embed into a website to highlight the impacts of your projects. This dashboard will update automatically whenever your project data changes.
To use this feature, navigate to the Settings page by clicking on the name of your institution at the top of the screen. From there, click on the Sharing sub-tab. Scroll down and choose between four and eight metrics to display in the dashboard, click on the layout you prefer, and hit the “Save and Regenerate” button. You’ll see a preview of your Public Dashboard that looks like the example below. Copy the embed code and paste it into the backend of a website to display the Public Dashboard there.
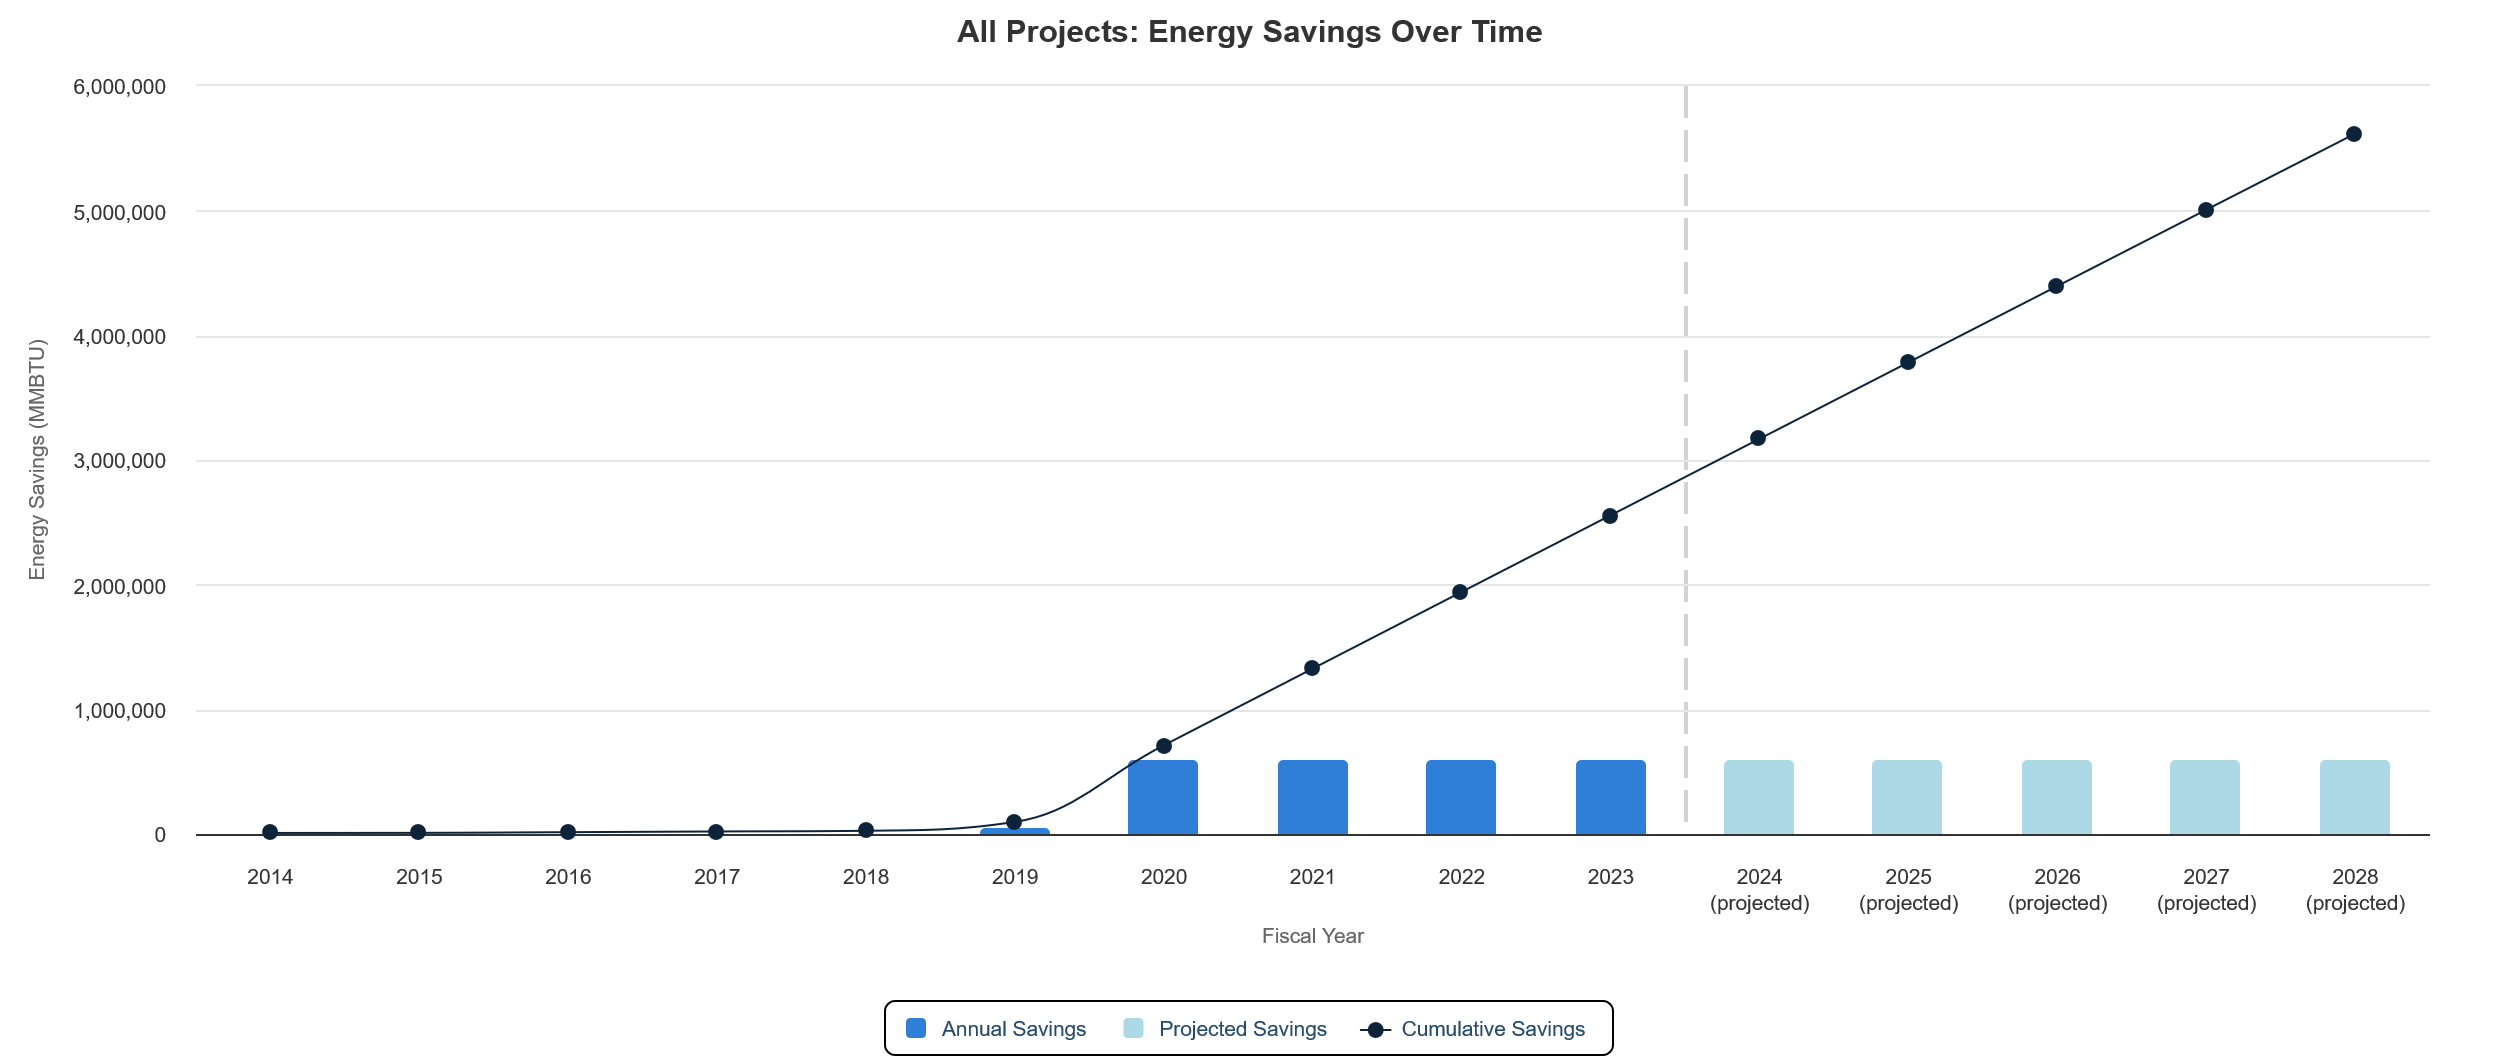
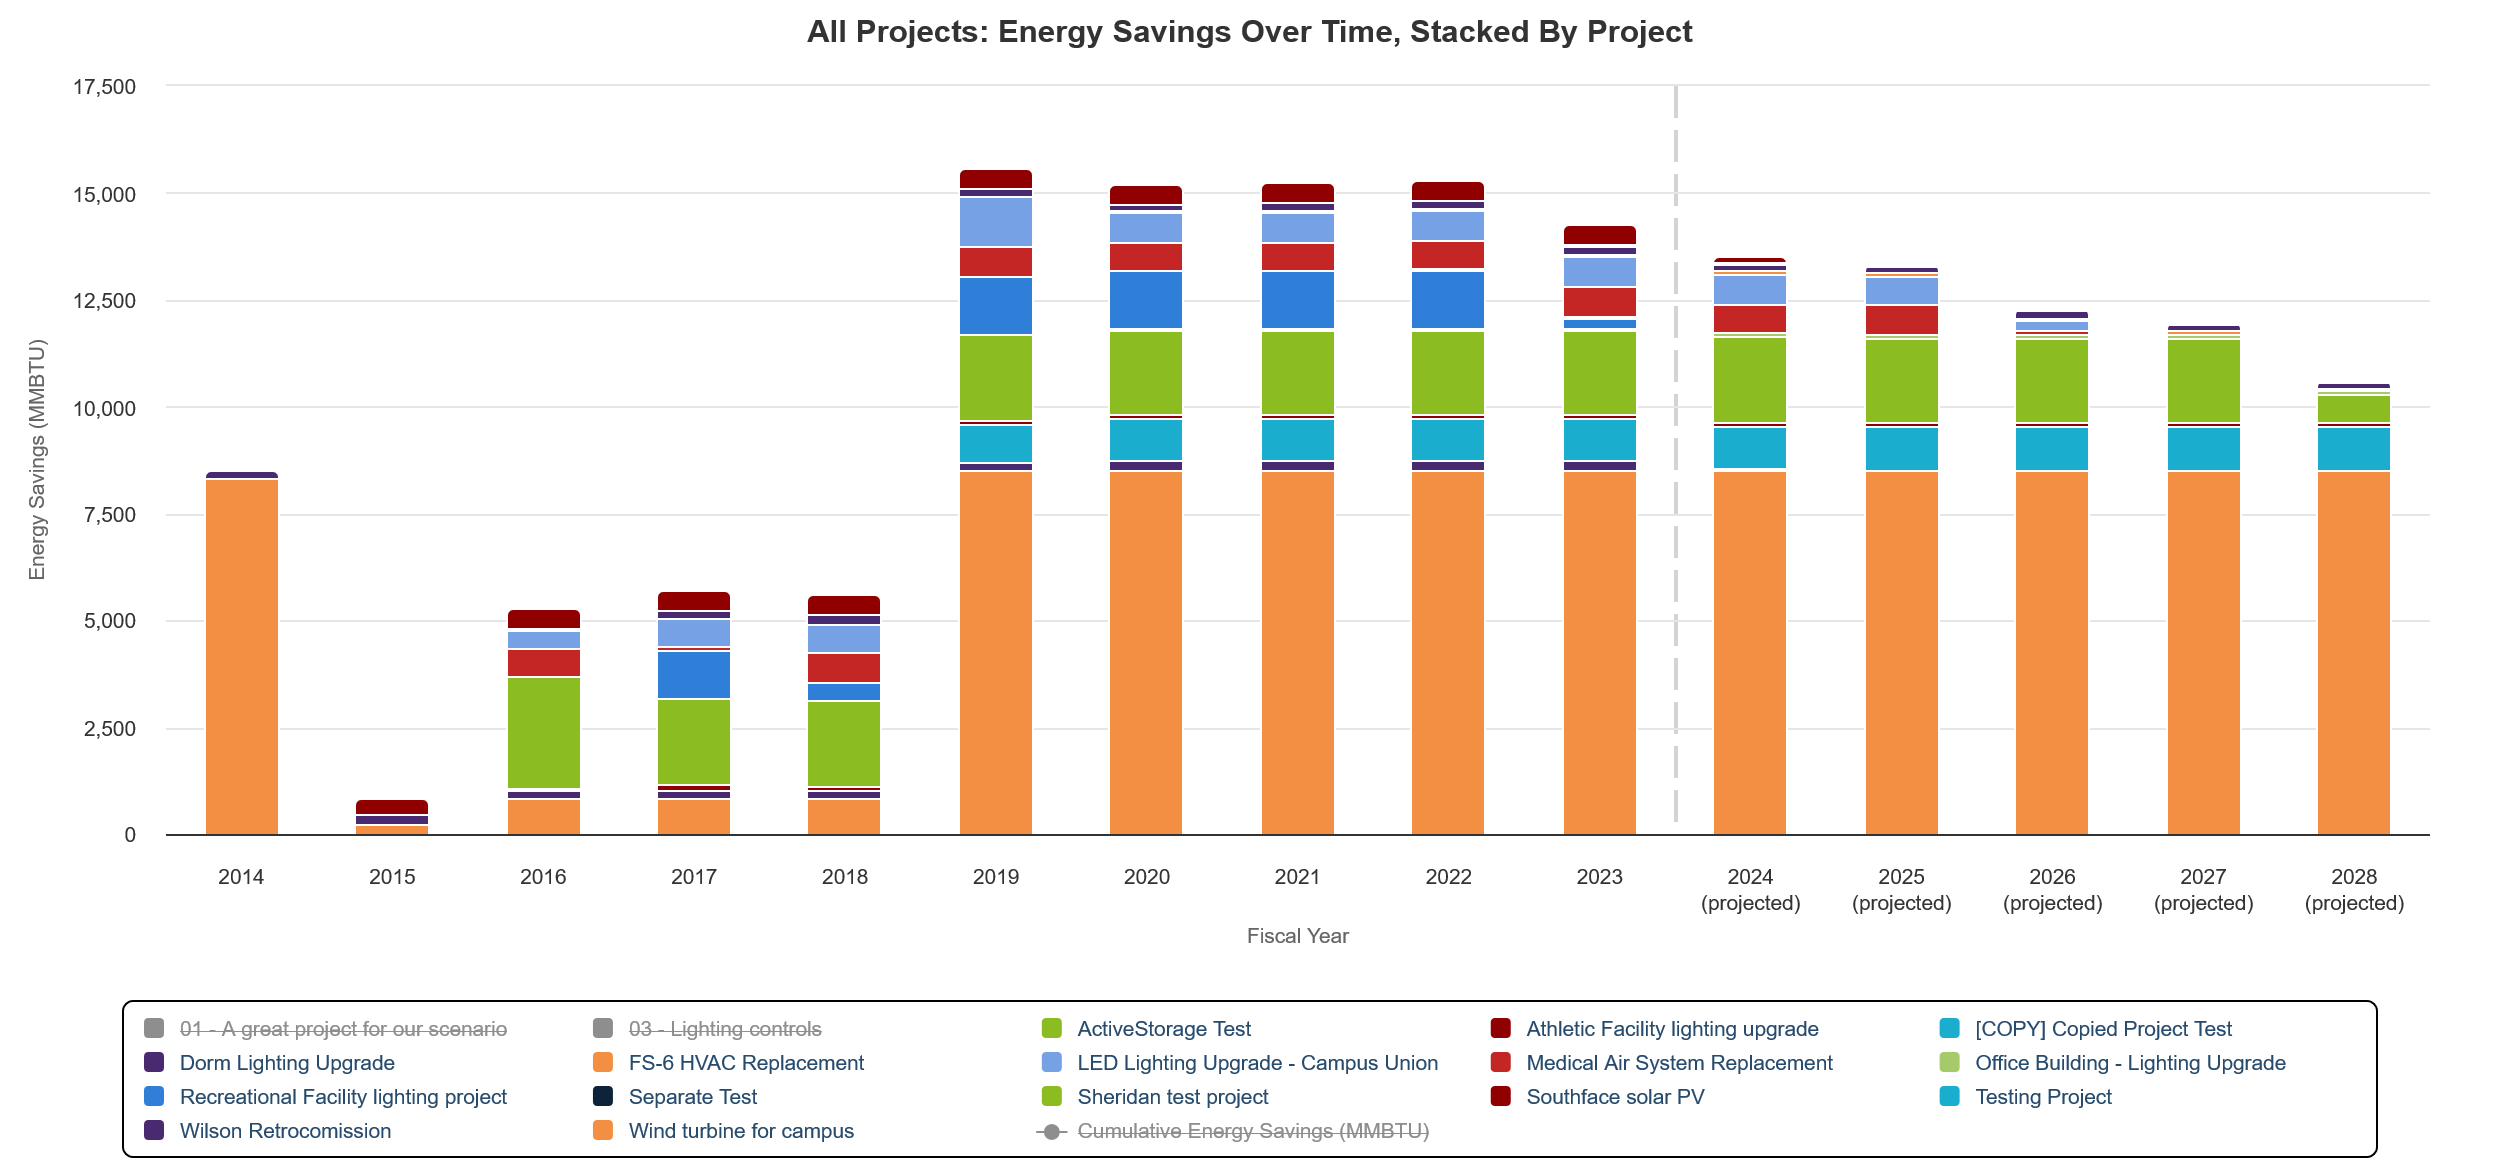
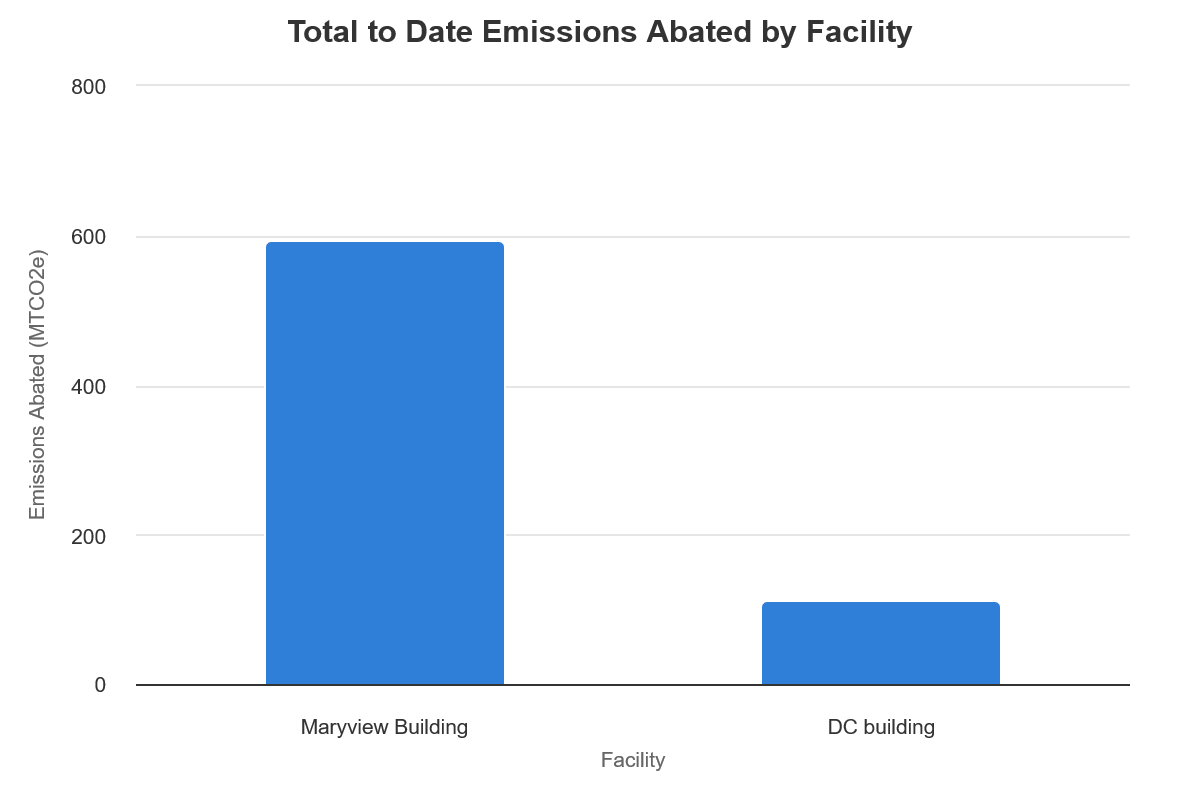
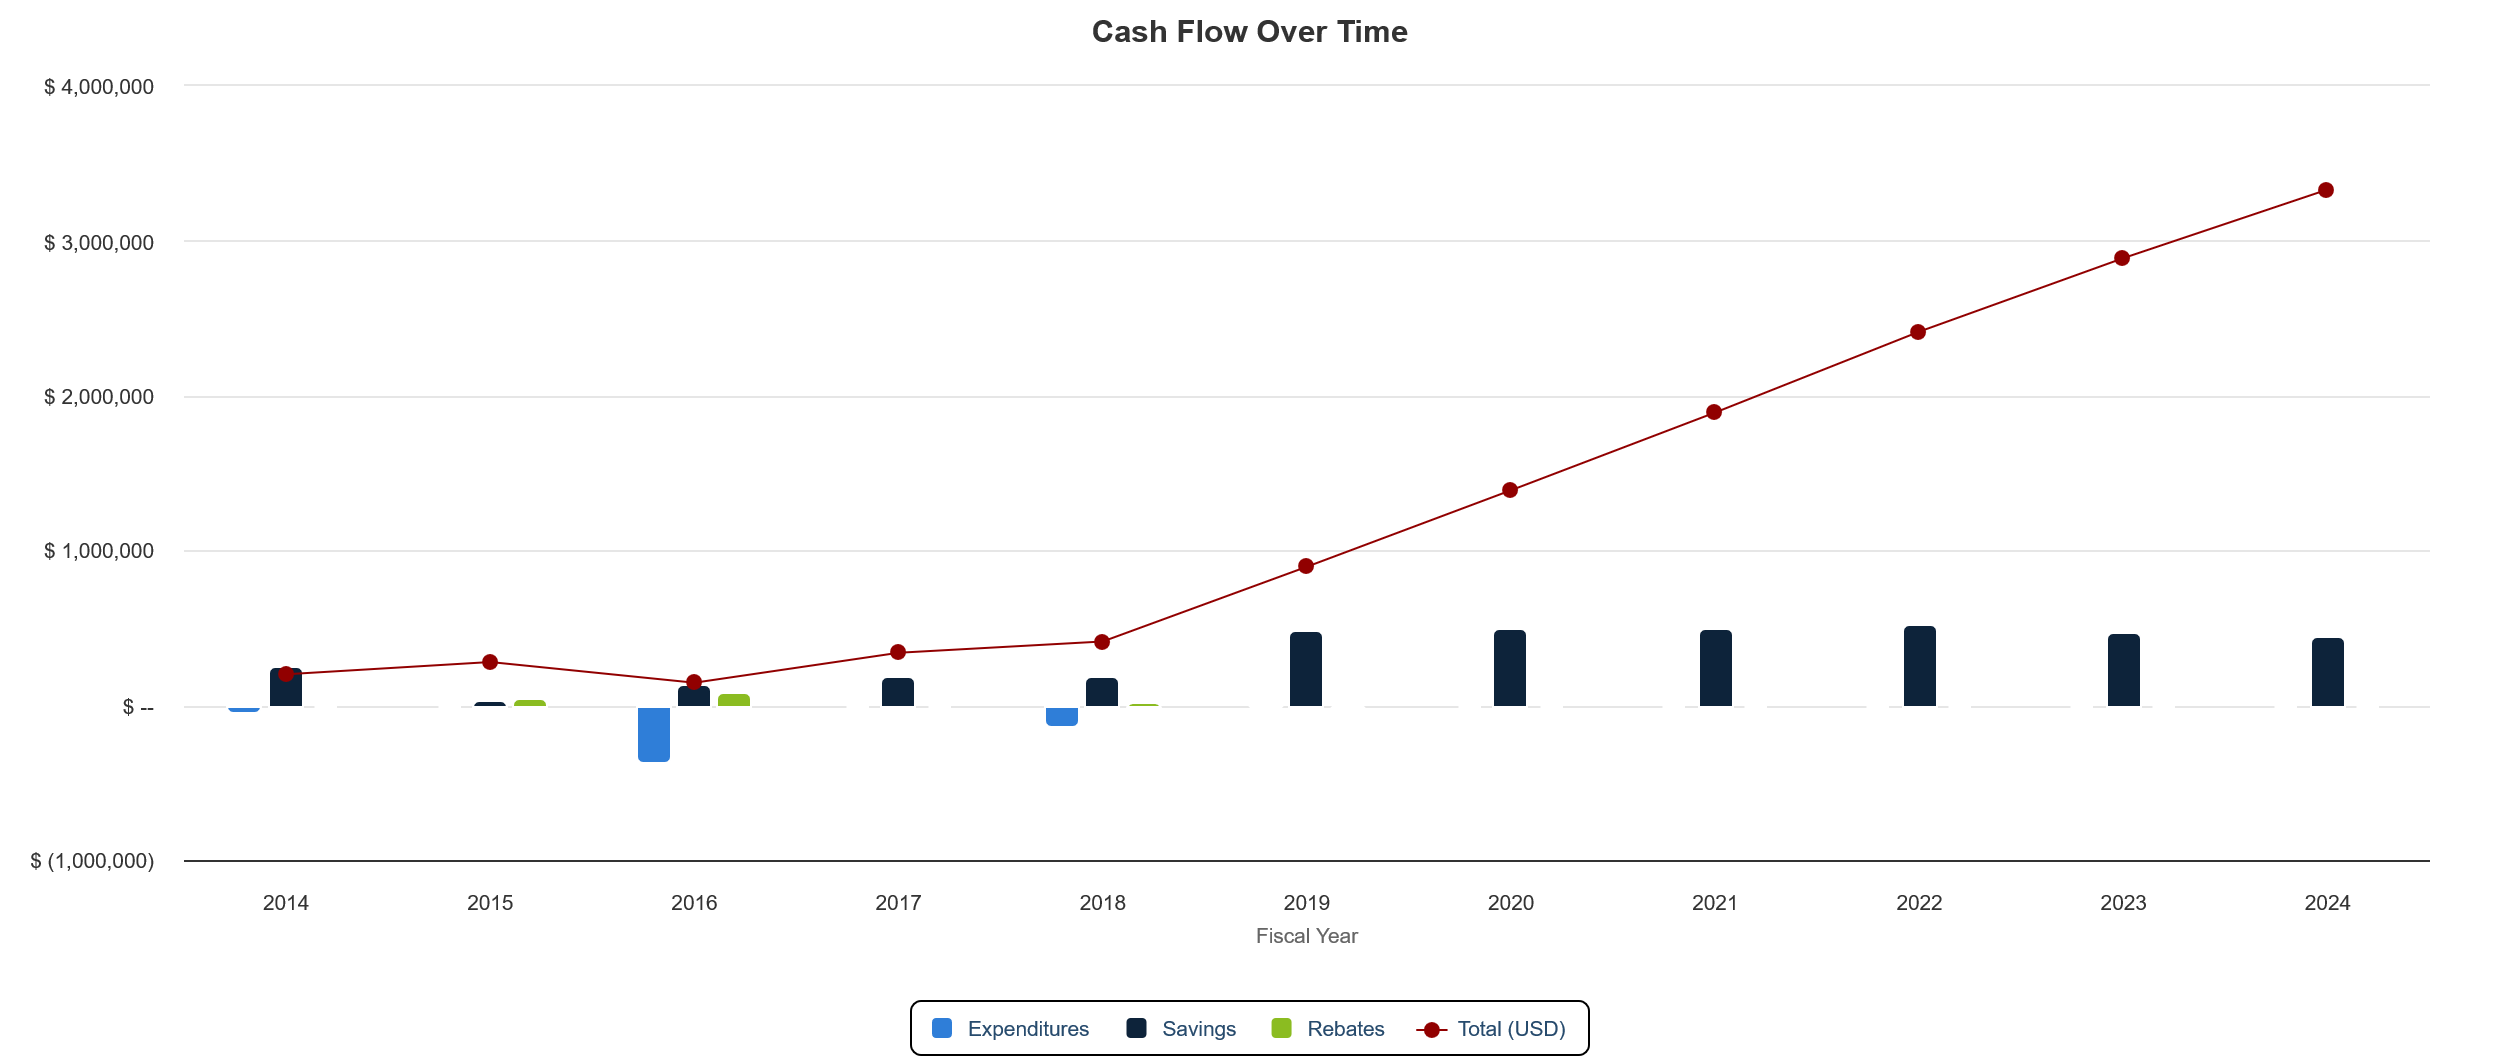
5) Reports tab charts: Quickly generate charts that illustrate the carbon, energy, financial, waste, and water savings achieved by your projects. All charts can be downloaded as PNG files or exported to PDF for inclusion in reports or websites.
To use this feature, click on the Reports tab and choose the chart that you’d like to generate from the options in the list. When the chart has generated, click the “Download Image (.PNG)” button above the chart to get the PNG version. If you want to build a multi-chart report, click the “multiple” button at the top of the list of chart options. Choose some charts and hit the plus (+) symbol that appears next to them to add them to your report. When you’re finished, click the “Print” button that appears in the upper right corner of the Reports tab to either print your report or export it to PDF.
Sustainability action plan sharing features
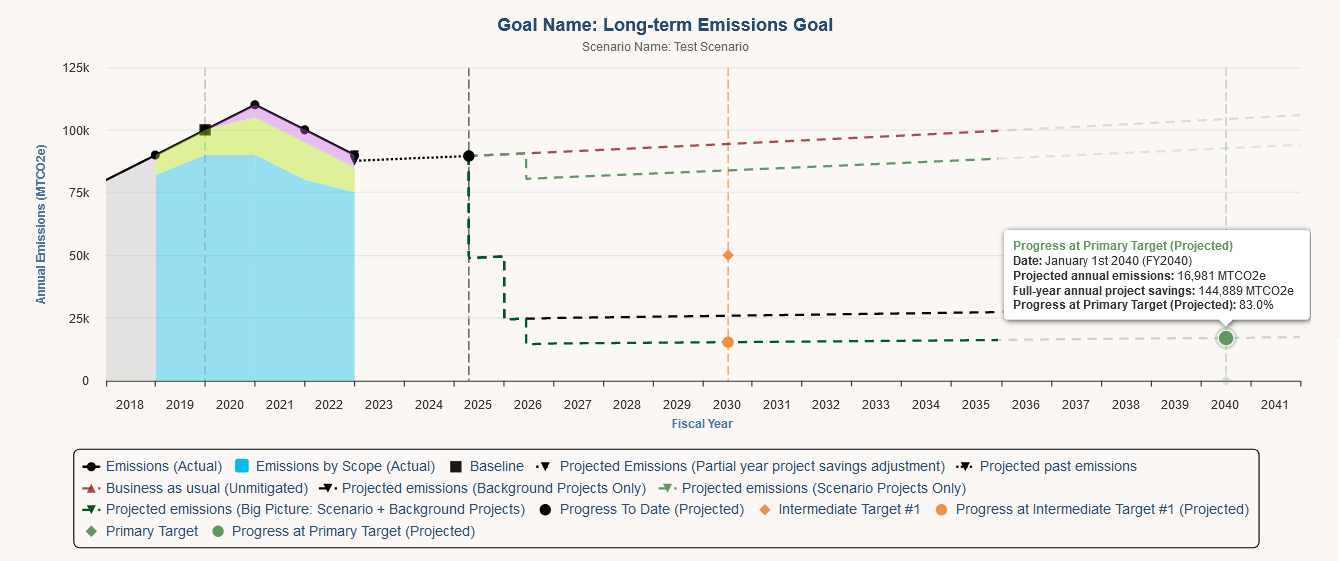
6) Scenario chart: You can use GRITS to design pathways for achieving your institution’s climate action plan or complying with state or local targets for building efficiency. Quickly generate a chart that illustrates the anticipated carbon, energy, waste, and water reductions achieved by your sustainability action plan model (“scenario”). Download a PNG file for inclusion in reports or social media sharing.
To use this feature, just click the “Download chart (.png)” button on any of your Scenario pages. In a few seconds, the image will be generated and downloaded to your computer.
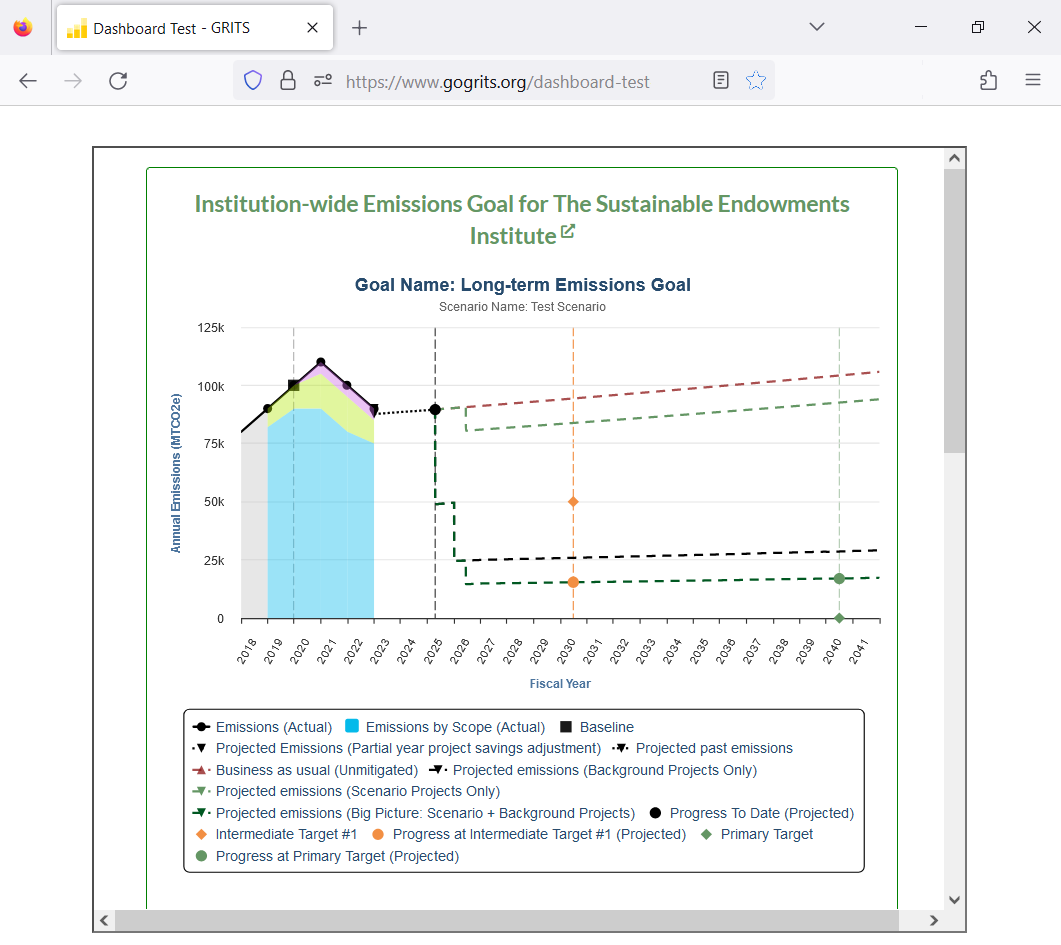
7) Scenario-level read-only webpages: This option allows you to share a link to a read-only webpage that displays all of the details of your scenario. This webpage will update automatically whenever your scenario data changes and can be viewed by anyone, even if they don’t have access to GRITS. You can easily revoke access later by disabling the link.
To use this feature, flip on the “Sharing” switch which appears near the top of each Scenario page. A new “Show Public URL” button will appear to the left. Click it to reveal the scenario’s custom shareable link, which you can share with an individual or post on a website.

8) Customizable and interactive Scenario Dashboards: Choose which sections of your scenario page that you’d like to display (even down to the specific metrics from each section), and GRITS will generate a dashboard that you can embed into a website to highlight the impacts of your scenario. This dashboard will update automatically whenever your scenario data changes.
To use this feature, click on the “</> Embed” button on any of your Scenario pages. A menu will open, allowing you to choose which sections of your Scenario page and the specific metrics in each that you’d like to display. After customizing your Scenario Dashboard, copy the embed code and paste it into the backend of a website to display it there.
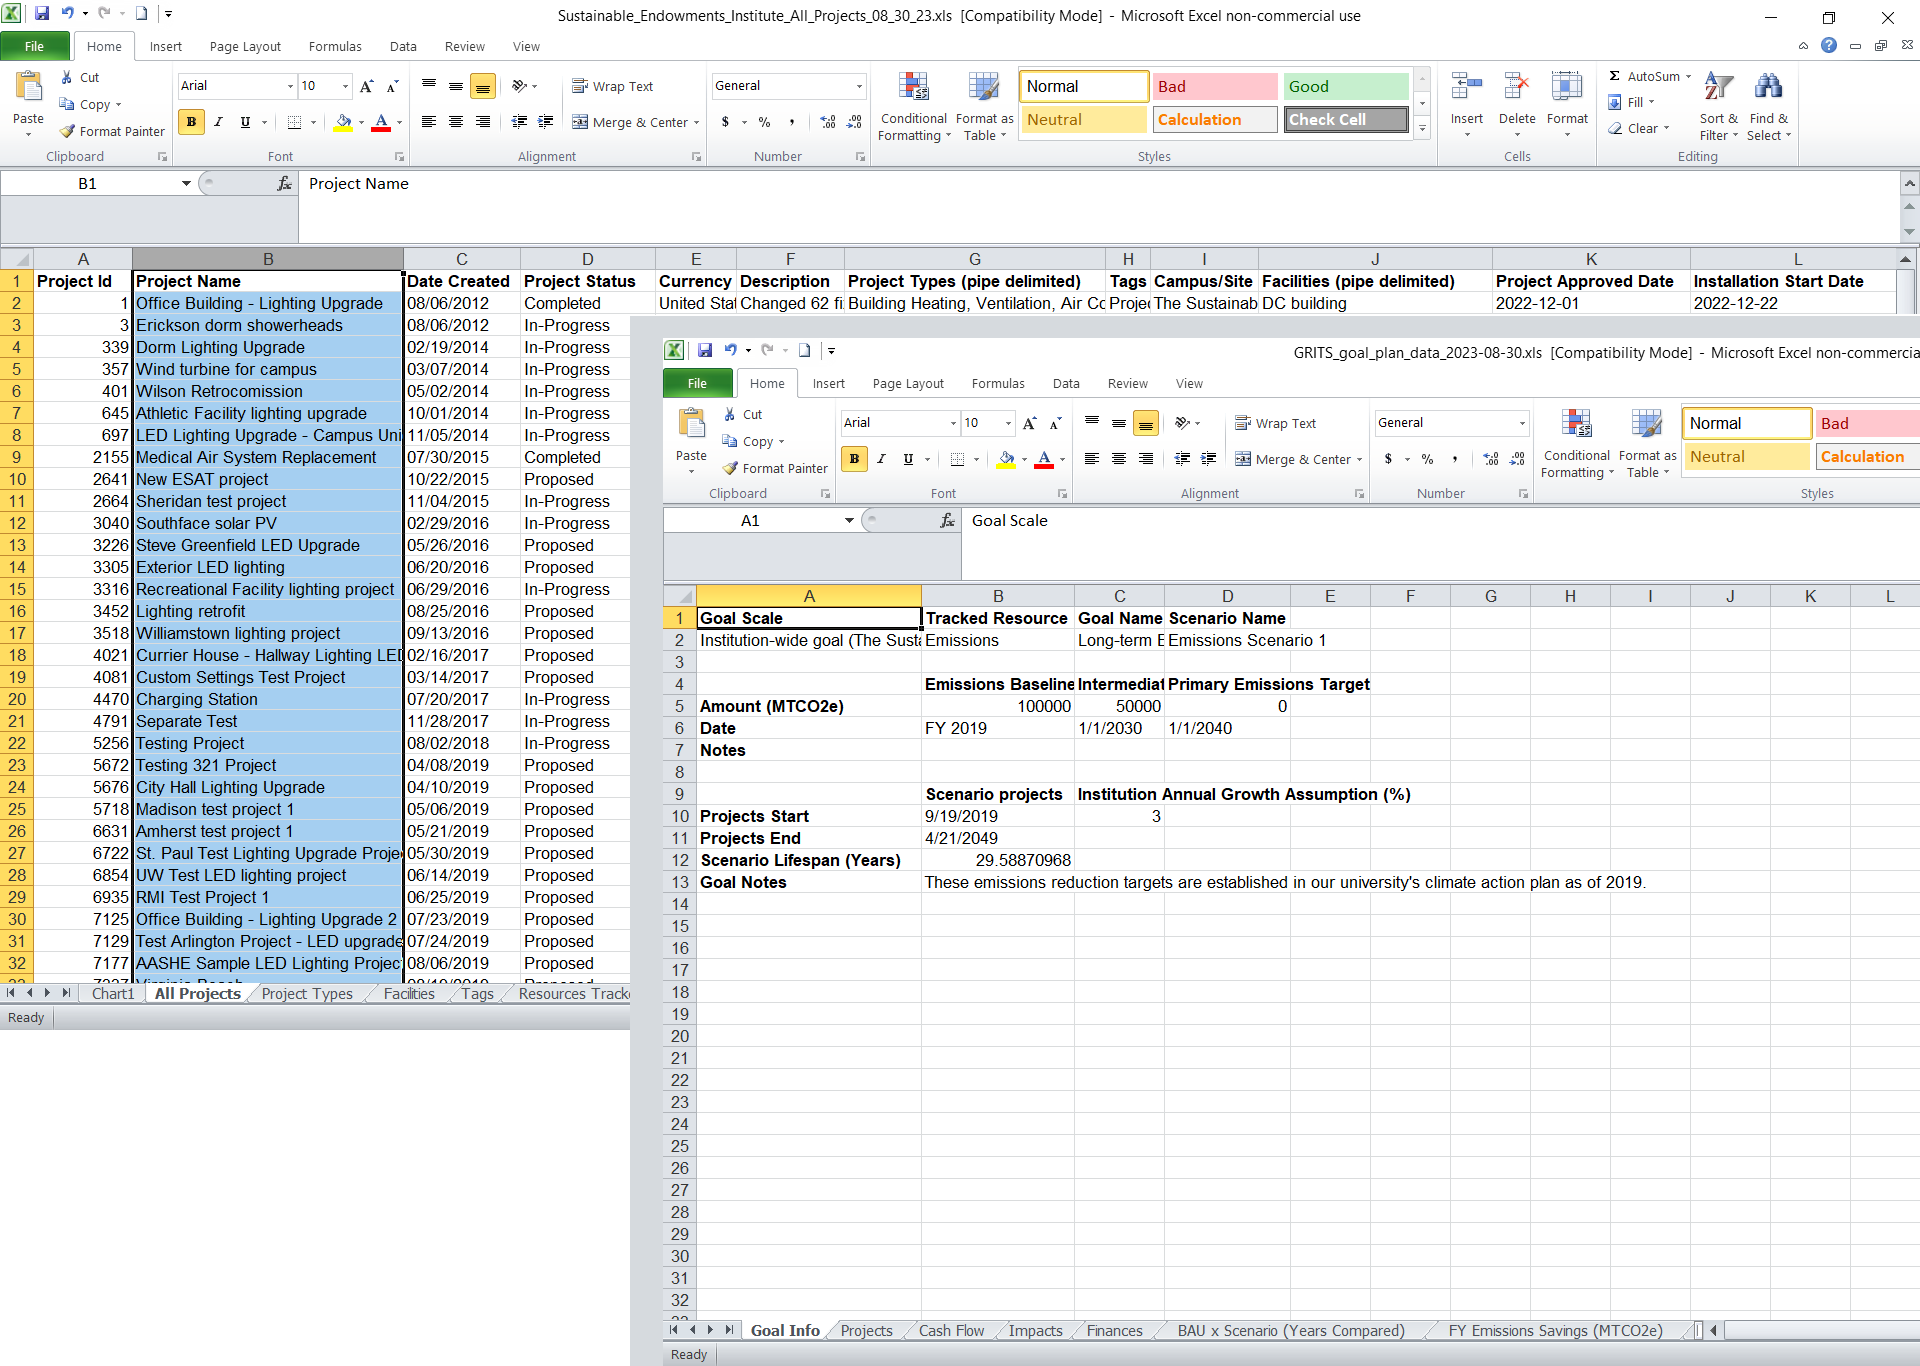
9) In addition to the various sharing options above, you can also download spreadsheets containing all of your project and goal scenario data. This allows you to go even further beyond the calculations performed by GRITS and work with your data any way you like.
To use this feature, just click the “Download All Projects (.xls)” button on the top of the Projects tab or the “Download Spreadsheet (.xls)” button on the top of any of your Scenario pages.