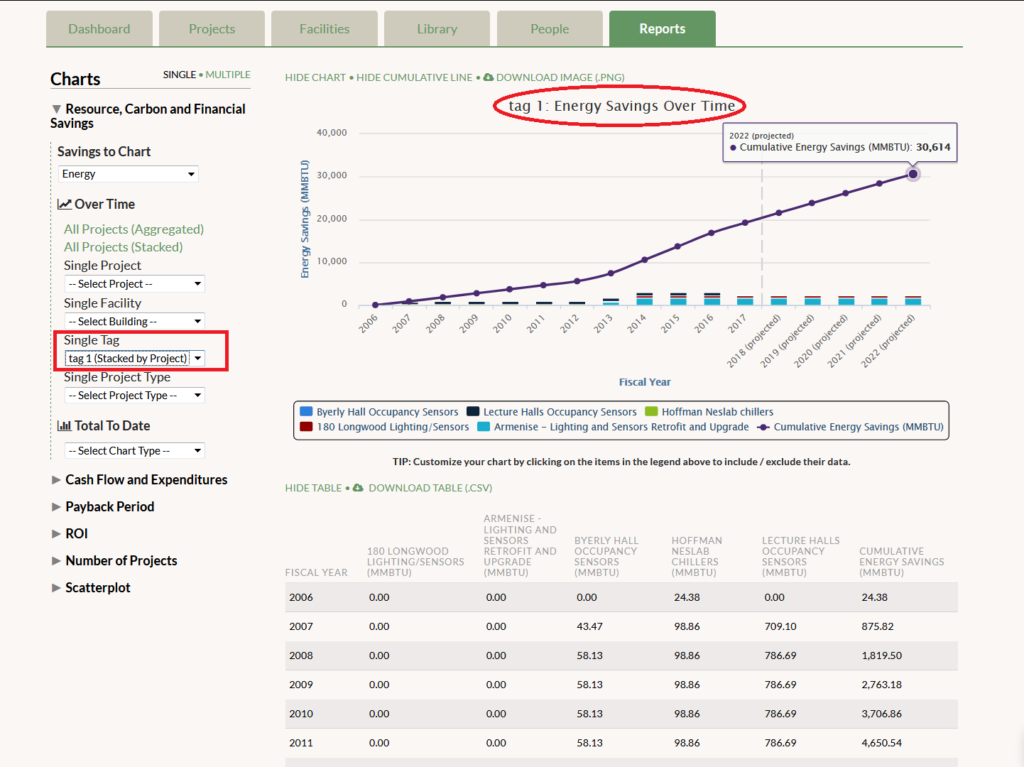
The launch of GRITS 3.0 brings many new features designed to make GRITS even more customizable—especially through the new tag (custom groups) feature. The Reports tab has been streamlined while adding additional chart options. Keep reading for more details or log into GRITS now to see the upgrades for yourself! Wiki Getting assistance when using GRITS just got easier, as we’ve moved the GRITS Guide into an online wiki, which you can access here. Follow the “Getting Started” portion of the wiki if you’re just starting to use GRITS. You can also use the search bar to find the topics you’d like to explore. As GRITS continues to add new features, this wiki will be regularly updated—no need to wonder if you have the most recent GRITS Guide! Tags Have you ever wanted to create a custom group of projects that can quickly be analyzed on the Projects tab or graphed on the Reports tab? That is now possible through the new tags feature. Create a custom tag to apply to your projects and use the new Tags filter on the Projects tab to isolate a specific group or groups and view the metrics GRITS calculates. On the Reports tab you are now able to select a single tag and create a graph of your custom project group. View this graph in “aggregate” form or choose “stacked” to display the savings contribution of each project individually, and then customize further by deselecting individual projects from the graph legend. Enhanced GRITS user interface We’ve updated GRITS’s infrastructure, and the platform’s interface along with it. One note in particular: table rows that can be expanded now have a green bar that appears when your cursor hovers over them. Bulk tagging and deleting On the Projects tab you are now able to select and modify multiple projects at once with the new bulk selection feature. Use this feature to add a tag to several projects or delete multiple projects simultaneously. New Reports options and layout We have streamlined the Reports tab, making the layout more concise and adding additional graphing options. You can now view savings over time by facility, campus, project type, or tag. Each graph can be viewed as an “aggregate” form (solid bars) or “stacked” form, which splits the bars according to the savings of each individual project. You can also view savings to date across these categories. A new format for graphing single projects displays their project status (Proposed, In-progress, or Completed). This new layout is a precursor to a fully customizable Reports tab that we will be building in the future! Bulk price changes via upload While GRITS allows you to update your resource prices (and the actual amount saved, if measured directly) for each fiscal year on a project-by-project basis, time constraints may have prevented you from making these updates. Now you can update the resource prices for all of your projects at once! Just send that data to us, indicating the resource type and fiscal years that the prices should apply, and we will input them—improving the accuracy of project calculations by adding additional real-world data. Customizable stats Users now have greater control over the metrics that GRITS calculates. In the new “Math, Units, and Stats” sub-tab on the Settings page, you can choose whether GRITS will use median or mean to calculate average values. Median will be the default, because it diminishes the impact of outliers (projects with savings much higher or lower than the rest of your projects). If you choose mean, which is just a simple average, you can also choose whether GRITS will include only relevant projects in your savings calculations (i.e., when calculating average water savings, only projects with water savings will be used to determine the average) or all projects (even those without relevant resource savings).