First, A Celebration 🎉 🎉 🎉
We’re going back in the time machine a bit to 15 years ago! 2007 was a banner year for sustainability initiatives at the university level, including the Sustainable Endowments Institute’s (SEI) first effort, the College Sustainability Report Card which debuted 15 years ago today. The very first Green Report Card of 100 private and public institutions, with 2.3 million students enrolled, analyzed everything from the administration to climate change policy to shareholder engagement and how they demonstrated commitment to sustainability.
The Report Card had a wide ranging impact throughout its five editions between 2007-2011. In part it even led to SEI building GRITS, for institutions to use to measure the progress of their sustainability efforts. With over 900 institutions having access to GRITS today, SEI has gone from grading academic institutions to helping institutions of all kinds keep score. Here are just a few of the news clipping highlights from the very first Report Card release on January 24, 2007.
GRITS Goals Sharing Features
Several new data sharing features have been added to the Goals tab in GRITS over the past few months. It’s now easier than ever to let others know about the climate action and sustainability master plans you’re building:
- All scenario data can be downloaded into a spreadsheet. The spreadsheet contains several individual sheets to capture each section of the Scenario page: Goal Info, Scenario Projects (individual project stats), Cash Flow, Impacts, Finances, BAU x Scenario (comparing emissions/resource consumption under business as usual to the scenario across each fiscal year), Fiscal Year Emissions/Resource Savings (a project-by-project breakdown of yearly savings).
- A read-only version of the entire Scenario page can be shared with others (even those without GRITS access) via a custom link.
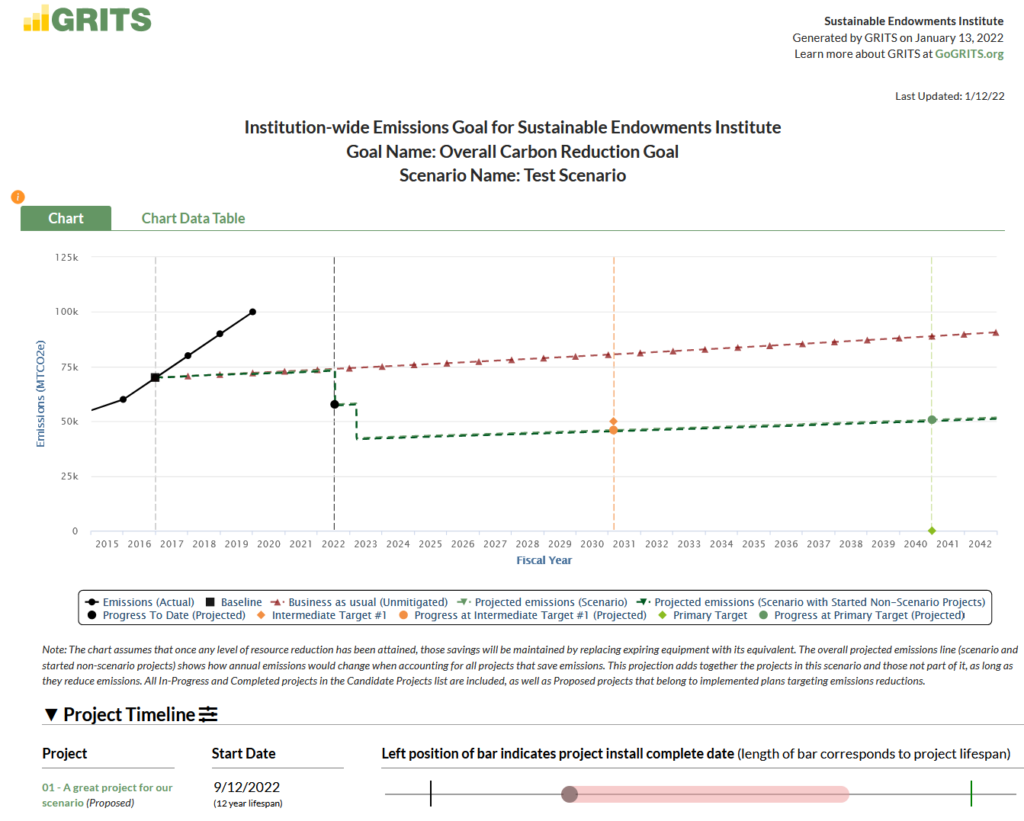
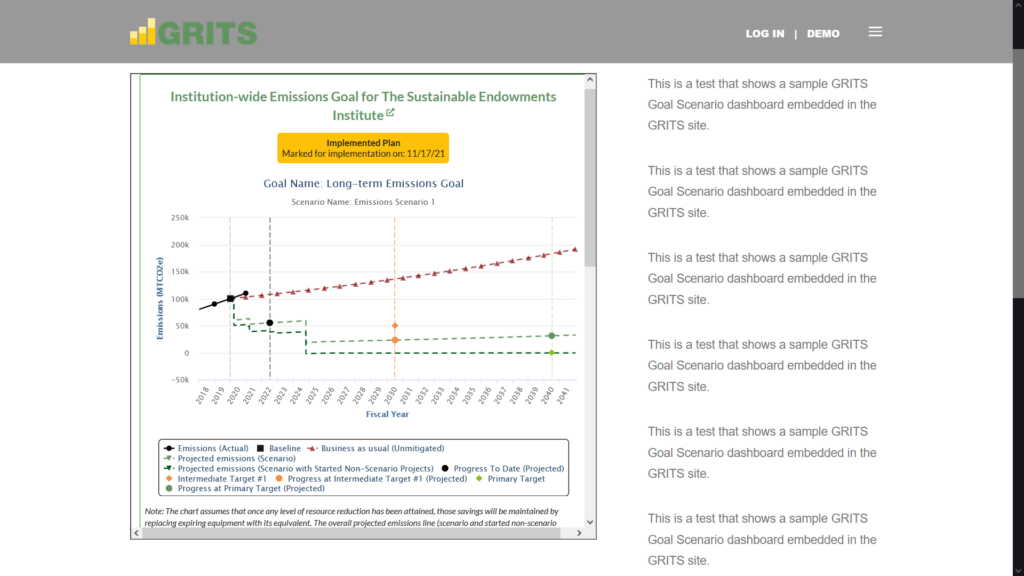
- A customized and interactive public dashboard containing pieces of the Scenario page can be embedded into your institution’s website to convey the impact of the scenario to stakeholders. You can select whether to include the Scenario Chart, Project Timeline, Impacts table, and Finances table. Individual metrics in the tables can also be excluded from the dashboard.
Upcoming Webinar
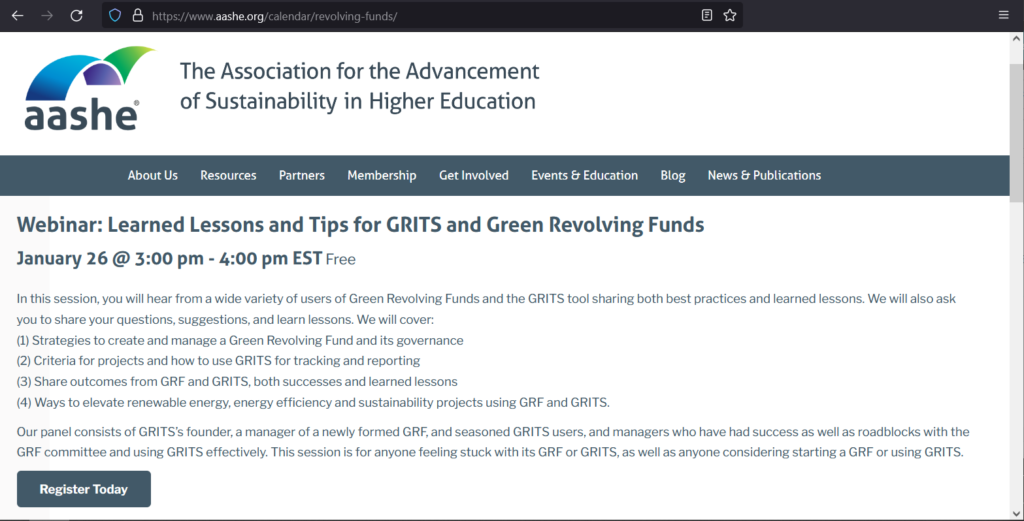
Learned Lessons and Tips for GRITS and Green Revolving Funds, January 26, 3-4pm EST
Join us as we present on an AASHE webinar discussing both Green Revolving Funds and GRITS. Learn more and register for free here.
Greetings from the team and we wish you a happy and healthy 2022!
Mark, Aaron, Deb and the whole SEI Team