Uncategorized

A Rundown of GRITS Sharing Features (with instructions)

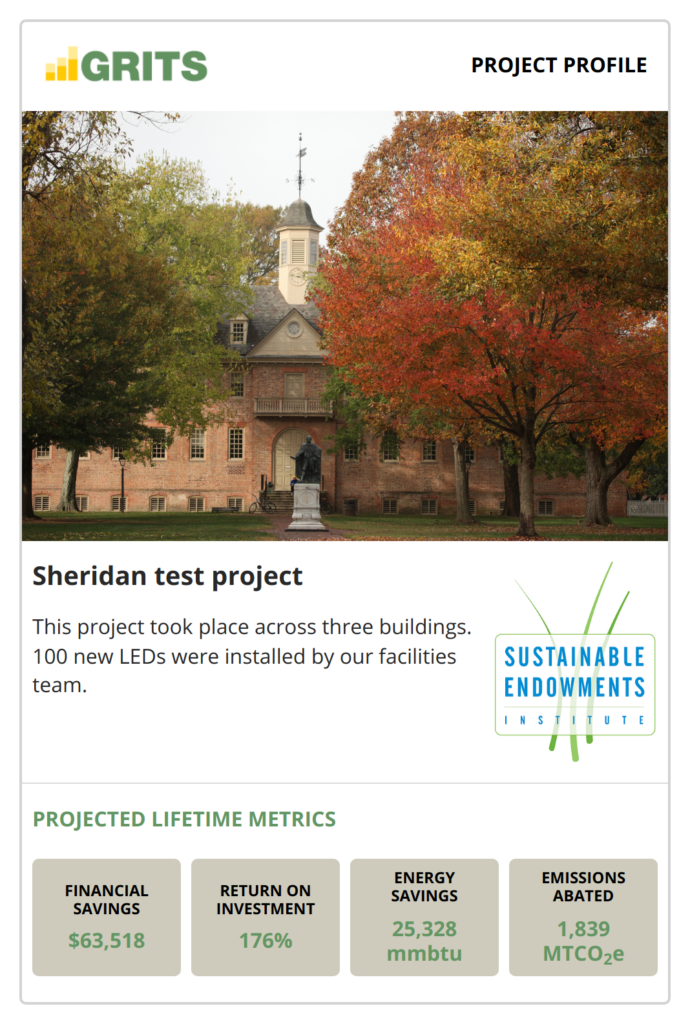
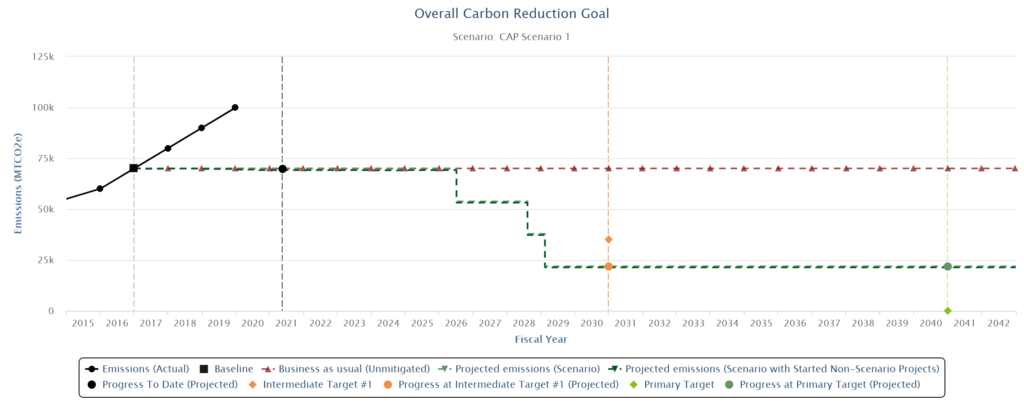
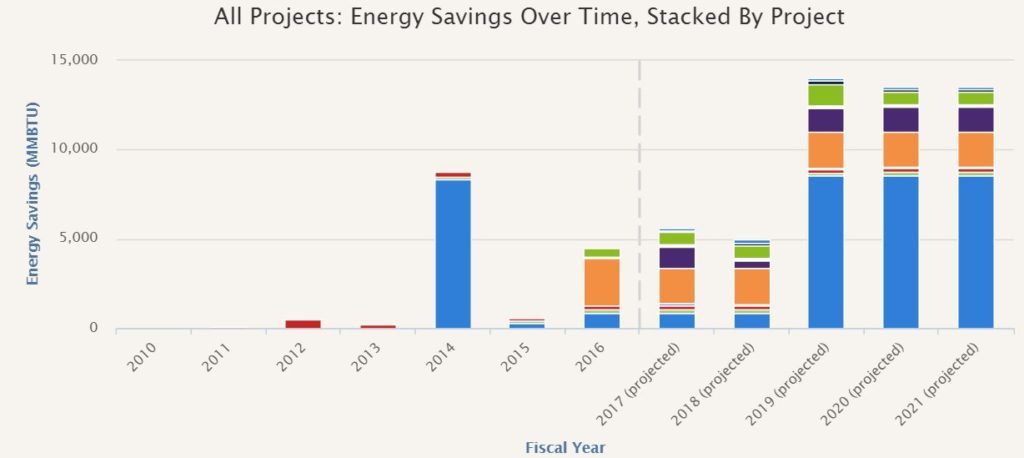
GRITS offers numerous features for sharing your project-level, portfolio-wide, and sustainability action plan data. With so many ways the platform can help you communicate the impacts of your work, we thought it could be helpful to put together a list! Project-level sharing features 1) Project-level PDFs: Export all of the details associated with each project into an easy-to-read PDF format in one click. Build a report from these PDFs to share with others. To use this feature, just click the “Generate PDF” button on any of your Project Details pages. In a few seconds, you will be able to download the generated PDF right on that page. You’ll also receive a copy of the PDF sent to your email. 2) Project Profiles: The Profile is a widget that displays your project’s name, description (up to around 120 characters), lifetime energy/carbon/water/waste/financial savings and return on investment, any publicly visible cover photo that you’ve chosen, and your institution’s logo (if available). It’s a great option for publicly highlighting your project’s impact in a more compact format than the project-level webpage. You can either embed this widget in a website (it will update automatically whenever your project data changes) or download these images as PNG files for social media posts. To use this feature, click on the Sharing sub-tab on any of your Project Details pages. There you’ll find each Project Profile layout option. To make them more engaging, upload your institution’s logo (on the Settings page, which is accessed by clicking on the name of your institution at the top of the screen) and a public cover photo for the project (on the Cover Photo / Attachments sub-tab to the left of the Sharing sub-tab)–these images will appear in your Profiles as in the examples below. Click the “Download as an Image” button below either Project Profile layout to get the PNG version, or copy the embed code and paste it into the backend of a website to display the live version. 3) Project-level read-only webpages: Looking just like the project-level PDF, this option allows you to share a link to a read-only webpage that displays all of your project’s details. This webpage will update automatically whenever your project data changes and can be viewed by anyone, even if they don’t have access to GRITS. You can easily revoke access later by disabling the link. To use this feature, flip on the “Sharing” switch which appears on the front of each Project Details page. A new “Show Public URL” button will appear to the left. Click it to reveal the project’s custom shareable link, which you can share with an individual or post on a website. Portfolio-wide data sharing features 4) Customizable Public Dashboard: Choose between four and eight metrics that aggregate data across your project portfolio and select your preferred layout, and GRITS will generate a Public Dashboard that you can embed into a website to highlight the impacts of your projects. This dashboard will update automatically whenever your project data changes. To use this feature, navigate to the Settings page by clicking on the name of your institution at the top of the screen. From there, click on the Sharing sub-tab. Scroll down and choose between four and eight metrics to display in the dashboard, click on the layout you prefer, and hit the “Save and Regenerate” button. You’ll see a preview of your Public Dashboard that looks like the example below. Copy the embed code and paste it into the backend of a website to display the Public Dashboard there. 5) Reports tab charts: Quickly generate charts that illustrate the carbon, energy, financial, waste, and water savings achieved by your projects. All charts can be downloaded as PNG files or exported to PDF for inclusion in reports or websites. To use this feature, click on the Reports tab and choose the chart that you’d like to generate from the options in the list. When the chart has generated, click the “Download Image (.PNG)” button above the chart to get the PNG version. If you want to build a multi-chart report, click the “multiple” button at the top of the list of chart options. Choose some charts and hit the plus (+) symbol that appears next to them to add them to your report. When you’re finished, click the “Print” button that appears in the upper right corner of the Reports tab to either print your report or export it to PDF. Sustainability action plan sharing features 6) Scenario chart: You can use GRITS to design pathways for achieving your institution’s climate action plan or complying with state or local targets for building efficiency. Quickly generate a chart that illustrates the anticipated carbon, energy, waste, and water reductions achieved by your sustainability action plan model (“scenario”). Download a PNG file for inclusion in reports or social media sharing. To use this feature, just click the “Download chart (.png)” button on any of your Scenario pages. In a few seconds, the image will be generated and downloaded to your computer. 7) Scenario-level read-only webpages: This option allows you to share a link to a read-only webpage that displays all of the details of your scenario. This webpage will update automatically whenever your scenario data changes and can be viewed by anyone, even if they don’t have access to GRITS. You can easily revoke access later by disabling the link. To use this feature, flip on the “Sharing” switch which appears near the top of each Scenario page. A new “Show Public URL” button will appear to the left. Click it to reveal the scenario’s custom shareable link, which you can share with an individual or post on a website. 8) Customizable and interactive Scenario Dashboards: Choose which sections of your scenario page that you’d like to display (even down to the specific metrics from each section), and GRITS will generate a dashboard that you can embed into a website to highlight the impacts of your scenario. This dashboard will update automatically

A Rundown of GRITS Sharing Features (with instructions) Read More »

Announcing GRITS-SIMAP Sync Feature

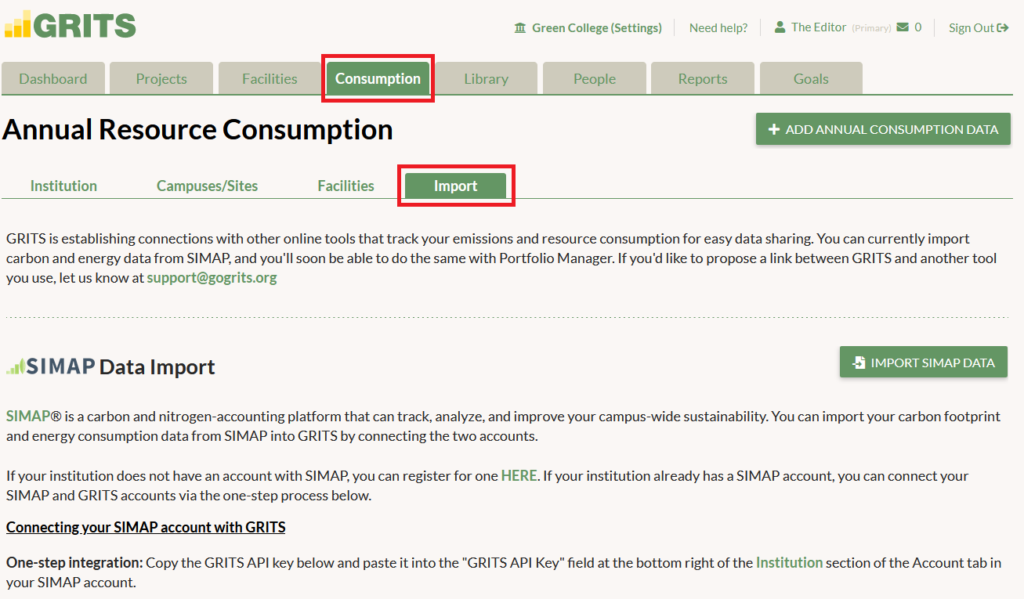
*Read below to learn about a limited-time promo (until 11/1/21) through which new or renewing GRITS Unlimited subscribers will get a complementary subscription to the SIMAP carbon and nitrogen accounting platform.* We are excited to announce the launch of a new sync feature in GRITS that allows SIMAP users to import their carbon inventory and energy consumption data to jumpstart the climate action planning process! In late 2020, we released a suite of new features called GRITS Goals that allows users to assemble groups of sustainability projects into resource reduction scenarios. These scenarios illuminate potential pathways that institutions can take to achieve their emissions, energy, water, and waste reduction targets, modeling climate action or sustainability master plans. The new GRITS-SIMAP sync feature allows for a quick import of emissions and energy data from users’ SIMAP account into GRITS. The imported data can be used as a baseline in GRITS Goals scenarios, and also enables users to compare how actual campus resource consumption matches up with the scenario projections. To help celebrate Campus Sustainability Month in October, we’re offering a complementary SIMAP Tier 1 subscription for any institution that subscribes (or renews an existing subscription) to GRITS Unlimited! Current SIMAP users are also welcome to take advantage of this opportunity to extend their access. This special promotion combines a free SIMAP subscription with the GRITS discount provided through our partnership with SIMAP. For example, an institution that subscribes to GRITS for two years will get the 15% discount for two-year subscriptions AND have SIMAP access covered for both years (an additional $800 value). This promo will last throughout Campus Sustainability Month and end on November 1, 2021. We hope that the new GRITS-SIMAP sync feature helps to support your sustainability work! (Read below to see how to use the new feature.) Thank you! The GRITS Team Import Data from SIMAP To integrate your GRITS and SIMAP accounts, just enter the GRITS API key that you find on the Import sub-tab in GRITS into the Institution section of the Account tab in your SIMAP account. Before initiating your import, ensure that the emissions factors settings in SIMAP match your institution’s preferences and choose which SIMAP campuses to import. You’ll see a brief explanation of each setting below your GRITS API key. Once you’ve configured your emissions factors settings, click the “Import SIMAP Data” button. Choose which years to import and then click the “Load Data” button. You’ll see the aggregate data from all of the SIMAP campuses you’ve selected for each year. Choose whether to import emissions data, energy data, or both. You’ll also specify the emissions stat you’d like to import, and indicate whether the aggregate data corresponds to your entire institution or to a single GRITS campus. Confirm that the aggregate data from SIMAP accounts for the total emissions or resource consumption at the scale (entire institution or individual campus) that you’ve chosen. If you previously entered data in any year you’ve selected to import, you can choose whether to overwrite it with the import or not. Click the “Save SIMAP Data” button and you’ll then see your imported data appear in the relevant tables on the Consumption tab.  

Announcing GRITS-SIMAP Sync Feature Read More »

GRITS Goals Launched: A Powerful New Tool for Climate and Energy Action Planning

Today we are excited to officially launch GRITS 4.0, headlined by GRITS Goals! This suite of features adds an entirely new dimension to GRITS, empowering users to develop detailed plans to meet both short-term and long-term carbon reduction and other resource efficiency targets. Goals is by far the largest expansion of the platform since we released GRITS 1.0 back in 2014. Users are now able to quickly build climate action plan models or track an existing plan’s impacts by assembling their projects into resource reduction scenarios at the institution-wide, campus/site, or building scale. GRITS Goals combines the platform’s business case analysis with customizable project timelines and dynamic charting to map out pathways from business-as-usual to aggressive energy, carbon, water, or waste reduction targets. Users will see the scenario’s environmental impacts like average annual carbon and energy savings alongside financial metrics such as return on investment and total lifetime cost savings. Watch the GRITS Goals launch webinar recording to get a full walkthrough tour and insights into how GRITS Goals might help your institution. A case study on how Vassar College is using GRITS Goals is also featured during the webinar. A huge thanks to our team (especially Aaron, Arvel and Deb), supporters, and users from over 800 institutions around the world that already use GRITS. If you’d like to learn more or get access to GRITS Goals please contact us. What’s new in GRITS 4.0: Consumption tab Goals tab Goal Page Scenario Page Consumption Tab The Consumption tab is where you can enter your carbon emissions inventory as well as energy and water consumption and waste production data. Goals Tab The Goals tab is where you can set up a resource reduction task–reducing emissions, energy and water consumption, or waste production from a baseline amount to a target in the future. Add intermediate targets to help you stay on track. Goal Page The Goal page is where you can visualize the parameters of the goal you created in chart form. Scenario Page On the Scenario page you can quickly develop detailed climate action plan models or track an existing plan’s impacts by assembling your projects into resource reduction scenarios.

GRITS Goals Launched: A Powerful New Tool for Climate and Energy Action Planning Read More »

Introducing GRITS 1.7!

Last year I wrote about why booking too far in advance can be dangerous for your business, and this concept of margin so eloquently captures what I had recognized had been my problem: I was so booked up with clients that I wasn’t leaving any margin for error, growth, planning, or reflection.

Introducing GRITS 1.7! Read More »