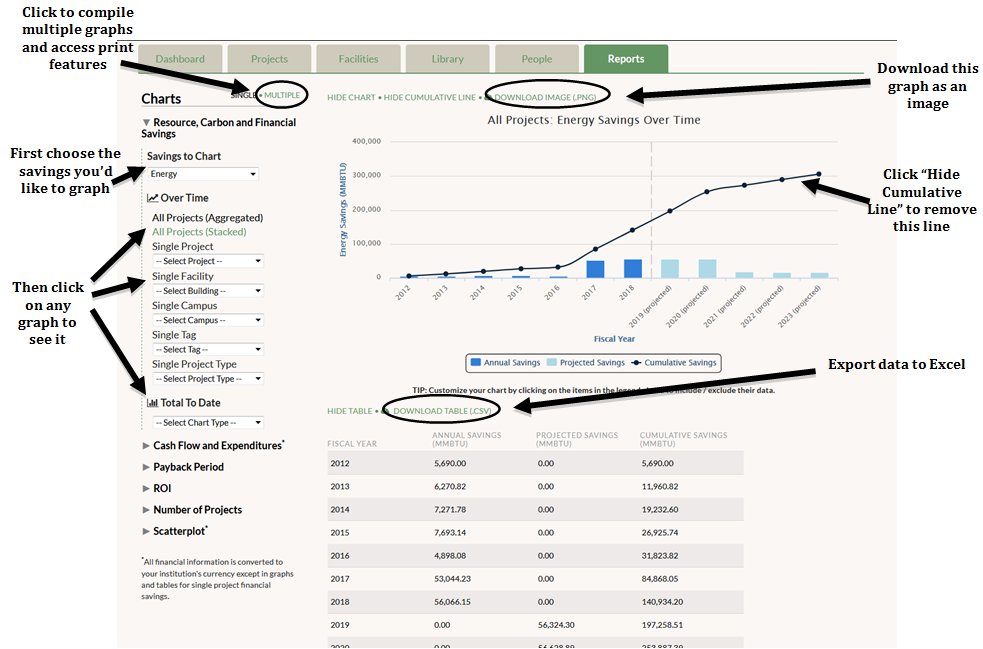
To create a graph, first choose the type of savings you want to visualize (energy, waste, water, financial, or carbon emissions). You can then select Over Time graph options that show year-by-year savings, including a projection for the next five years, or To Date graphs that illustrate total savings as of today’s date.
*Note on campus currencies: All financial savings graphs–except for the Single Project graph option–are converted to your institution-level currency (if any projects with a custom campus currency are included)
Over Time graphs
Note that for Over Time financial savings graphs, there are two bars for each fiscal year–one to show financial savings, which is in blue for past data and light blue for projected savings, and the other displaying the payback to the GRF for that year, which is colored black.
- All Projects (Solid Bar): This option appears as the default when opening the Reports tab. This solid-color bar graph displays all savings each fiscal year from all of your Completed and In-Progress projects. Future year savings are projections and are displayed in a lighter blue color. Click on “Hide Cumulative Line” to see the bar graph at a different scale.
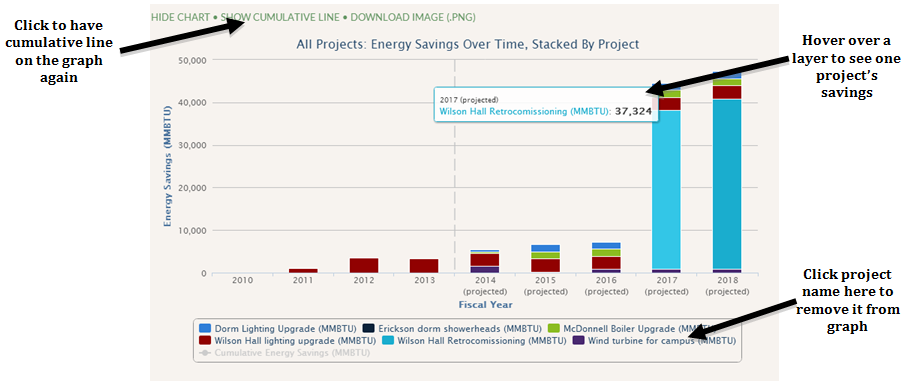
- All Projects (Stacked Bar): This multi-color bar graph also displays all savings from all of your Completed and In-Progress projects, showing you the savings contributed by individual projects each year. By hovering your cursor over one of the colored layers in a bar, you can see which project generated those savings. You can also view the legend to see the color that correlates to each project. If you want to remove any of the projects in the graph, click on that project’s name in the legend. Click on that project’s name again for it to reappear in the graph.
You can also explore your data more deeply by generating graphs of single items in GRITS.
- Single Project: Graph individual projects. Your projects are arranged according to their status: Completed, In-progress, or Proposed.
- Single Facility: Graph all In-Progress and Completed projects within a single building. Each facility has two graph options:
- Solid bar graph – clicking the facility name will generate a solid bar graph
- Stacked bar graph – clicking the (Stacked by Project) option will generate a multi-color bar graph showing savings from each project in the facility
- Single Campus: Graph all In-Progress and Completed projects within a single campus. This option will only appear if you have created more than one campus. Each campus has two graph options:
- Solid bar graph – clicking the campus name will generate a solid bar graph
- Stacked bar graph – clicking the (Stacked by Project) option will generate a multi-color bar graph showing savings from each project in the campus
- Single Tag: Graph all In-Progress and Completed projects linked to a single tag. Each tag has two graph options:
- Solid bar graph – clicking the tag name will generate a solid bar graph
- Stacked bar graph – clicking the (Stacked by Project) option will generate a multi-color bar graph showing savings from each project linked to the tag
- Single Project Type: Graph all In-Progress and Completed projects linked to a single Project Type. Each tag has two graph options:
- Solid bar graph – clicking the Project Type will generate a solid bar graph
- Stacked bar graph – clicking the (Stacked by Project) option will generate a multi-color bar graph showing savings from each project linked to the Project Type
Total Savings To Date graphs
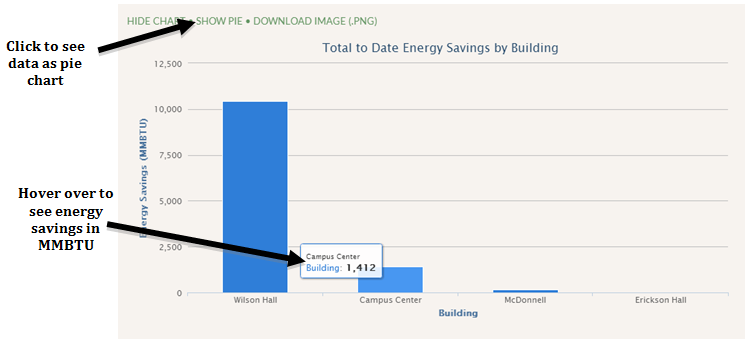
- By Facility: This graph displays total savings as of today’s date (displaying Completed projects only) for each building you have created in GRITS. If a single project was done across multiple buildings, the savings are divided equally among those buildings. In future versions of GRITS, users will be able to assign specific savings by building. Hover your cursor over a bar to view the savings for each building. Click on “Show Pie” to view it as a pie chart instead of as a bar graph.
- By Tag: This graph displays total savings as of today’s date (displaying Completed projects only) for each tag you have created in GRITS. If a single project is linked to multiple tags, the savings are divided equally among those tags. In future versions of GRITS, users will be able to assign specific savings by building. Hover your cursor over a bar to view the savings for each tag. Click on “Show Pie” to view it as a pie chart instead of as a bar graph.
- By Campus/Site: You’ll only see this option if you’ve created more than one campus/site. This graph displays total savings as of today’s date (displaying Completed projects only) for each campus/site you have created in GRITS. Hover your cursor over a bar to view the savings for each campus. Click on “Show Pie” to view it as a pie chart instead of as a bar graph.
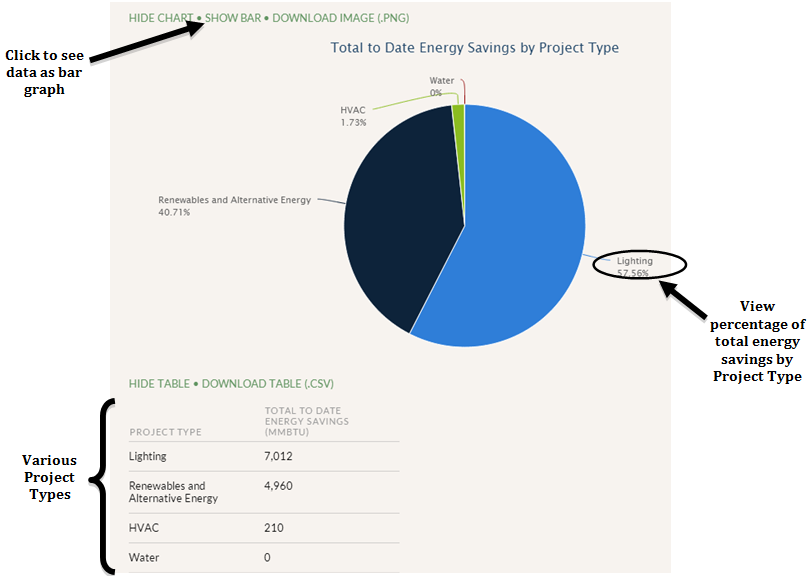
- By Project Type: This graph displays total savings as of today’s date (displaying Completed projects only), dividing the savings by Project Type. This gives the user an idea of which types of projects are generating the most savings. If a project belongs to multiple Project Types, the savings are divided equally among those Project Types. In future versions of GRITS, users will be able to assign specific savings by Project Type. Hover your cursor over a bar to view the savings for each Project Type. Click on “Show Pie” to view it as a pie chart instead of as a bar graph.