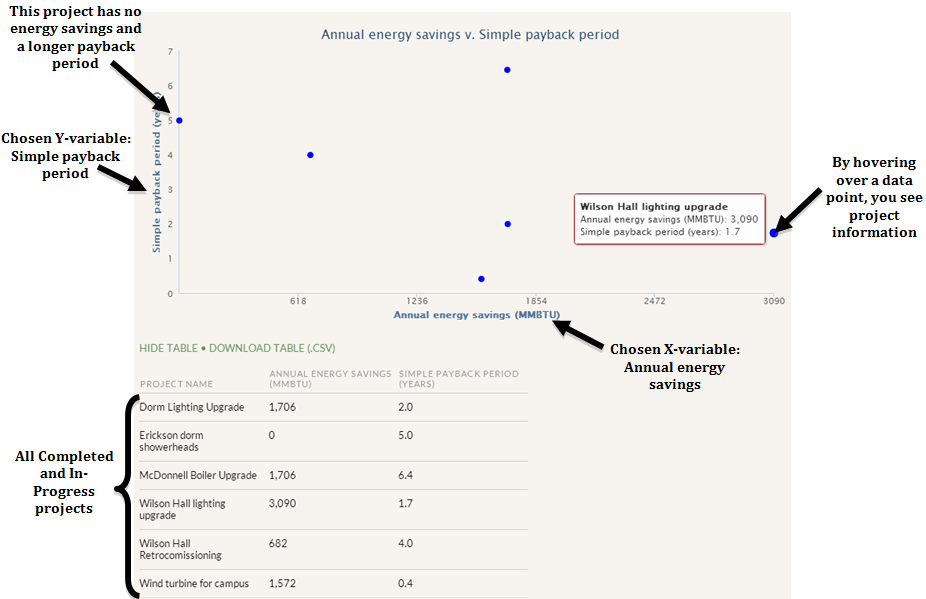
Scatterplots allow you to see all of your projects measured over two variables, seeing how the projects compare to each other. A majority of the X-variable choices are environmental benefits of the project, such as Annual emissions savings, Annual energy savings, Lifetime emissions savings, and Lifetime energy savings. Y-variable choices are based on financial performance, such as Annual ROI, IRR, Lifetime ROI, NPV, Project cost, and Simple payback period. Choose an X-variable and a Y-variable to create a scatterplot, then pinpoint which projects performed well both environmentally and financially by hovering over a data point.
You could choose the “Project cost” X-variable if you are curious to see which projects had low costs but high financial returns.
*Note on campus currencies: All financial information presented here is converted to your institution-level currency (if any projects with a custom campus currency are included).